
“There are clear ways that by pursuing these strategies the state of Montana can save hundreds of millions of dollars,” said Patty Hernandez, executive director of Headwaters Economics, a nonprofit research group based in Bozeman.
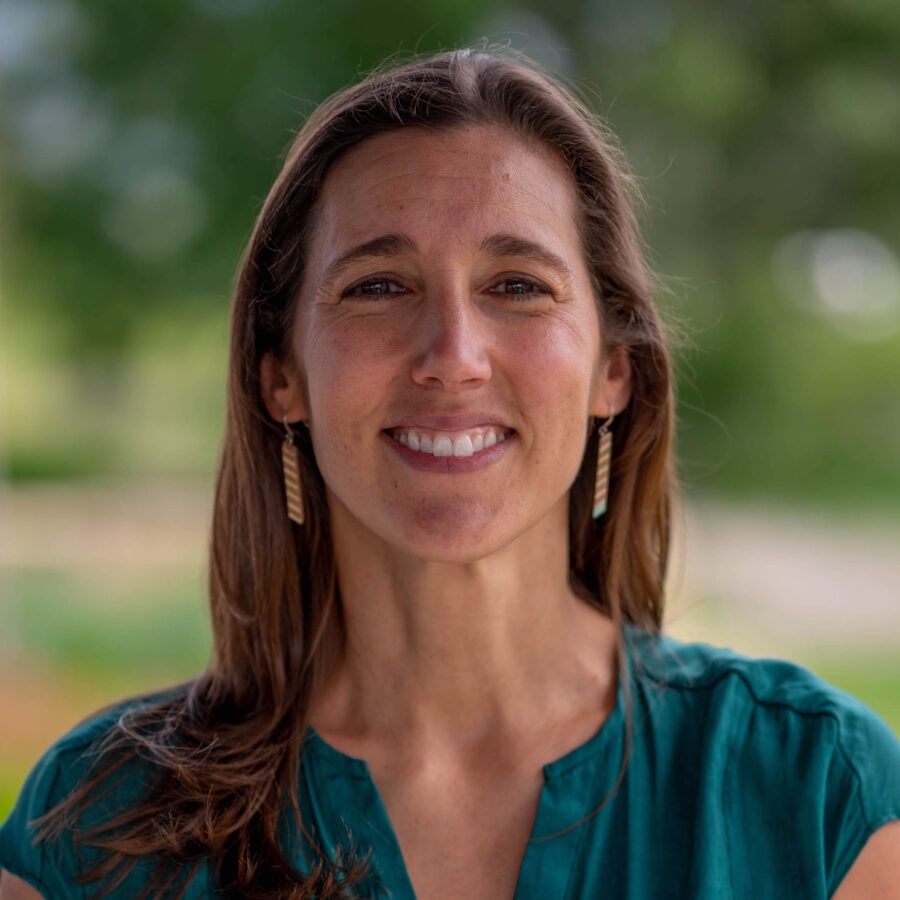
Patty Hernandez is co-founder and Executive Director of Headwaters Economics. She has played a formative role in building the highly productive team, positive culture, and impactful work for which Headwaters Economics is known.
Patty has 18 years of experience in economic development research, community assistance, technology solutions, and nonprofit leadership. She has led Headwaters Economics’ development of highly regarded interactive data tools—such as Neighborhoods at Risk and Wildfire Risk to Communities—that help communities adapt to climate change. In 2021 she also helped launch a new community assistance program: FloodWise Communities.
With an abiding interest in community development and equity, Patty has worked with a wide network of partners to identify and analyze relevant data for community planning and make it easily accessible. She has worked directly with local governments in 15 states spanning the country; federal agencies such as the U.S. Forest Service, the Bureau of Land Management, the U.S. Fish and Wildlife Service, and the National Oceanic and Atmospheric Administration; national organizations including the Urban Sustainability Directors Network, the American Society of Adaptation Professionals, the National League of Cities, the National Association of Counties, and the National Association of Development Organizations; and colleagues at academic institutions including the University of Washington, Stanford University, University of Oklahoma, University of Michigan, and Cornell.
To all her work Patty brings a commitment to rigorous research and a deep dedication to helping communities thrive in a changing world. She is one of four principal investigators for a multi-year National Academy of Sciences’ Thriving Communities project, and a co-principal investigator for the Pacific Northwest Regional Integrated Sciences and Assessments (RISA) program. Patty also leads the NOAA Climate Program Office fiscal policy working group and works closely with charitable foundations and leadership of other nonprofits to support sustainable community development.
Patty grew up in Miami, Florida, and holds a master’s degree in ecology. She spent two years in remote parts of Alaska working on public lands management before moving to Helena, Montana.
Reversing the legacy of rural disinvestment—and deliberately designing solutions for rural America—is a down payment on our shared future.
Federal maps designed to identify “at-risk and in-need” communities have failed to identify those at the lower end of the capacity spectrum.
A new map helps identify communities where investments in staffing and expertise are needed to support infrastructure and climate resilience projects.
From 2000 to 2021, the number of single-family homes in Montana grew by more than 42 percent, and the popularity of large lots converted 1 million acres of undeveloped land to housing.
How we manage population centers is intertwined with our conservation of wild areas. The more we create equitable population centers in places people want to live, the more we can create durable, landscape-scale conservation outcomes outside of towns.
Headwaters Economics and the Hispanic Access Foundation have released a report that shows that 44% of Latinos live in counties with high flood risk, as opposed to 35% of non-Latinos.
Headwaters Economics y Hispanic Access Foundation han publicado un reporte que muestra que el 44% de los latinos viven en condados con un alto riesgo de inundaciones, en contraste con el 35% de los no latinos.
Due to new methods and pandemic disruption, the 2020 American Community Survey shows some decrease in accuracy for equity-related measures.
People of color are at a high risk of being undercounted in the 2020 Census, jeopardizing federal funding, social services, and government representation.
Asian communities are at a high risk of being undercounted in the 2020 Census, jeopardizing federal funding, social services, and government representation.
Black communities are at a high risk of being undercounted in the 2020 Census, jeopardizing federal funding, social services, and government representation.
Hispanic and Latino communities are at a high risk of being undercounted in the 2020 Census, jeopardizing federal funding, social services, and government representation.
American Indian and Alaska Native communities are at a high risk of being undercounted in the 2020 Census, jeopardizing federal funding, social services, and government representation.
Find information on housing affordability by county and compare within your state. See the average share of wages spent on rent and mortgages in every U.S. county.
The new Wildfire Risk to Communities website—developed by the USDA Forest Service in partnership with Headwaters Economics and Pyrologix—offers maps and data about community wildfire risk nationwide.
Identify where potential bus rapid transit corridors in the Denver, Colorado Metro Area are most likely to enhance mobility and equity.
High worker productivity occurs across diverse counties and sectors but is not always connected with population growth and opportunity.
Download socioeconomic reports for states and counties near Bureau of Land Management units.
Integrate socioeconomic and climate data to map neighborhoods at risk in selected cities.
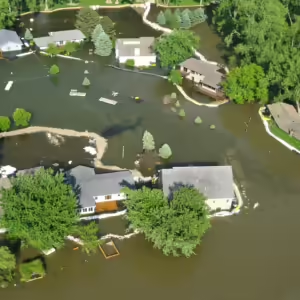
An analysis of FEMA’s BRIC program for climate adaptation and disaster resilience funding shows rising demand, but unequal access.
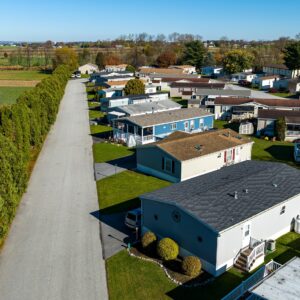
Many mobile home parks face higher flood risk and relocation may be the best option. A review of 12 mobile home park buyout projects illustrates how policy innovation and resident engagement can increase success.
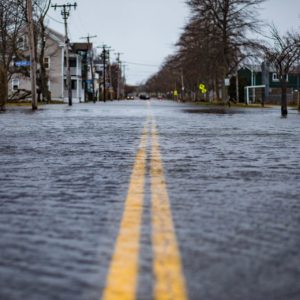
Headwaters Economics has analyzed the latest project selections announced by the Federal Emergency Management Agency for its Building Resilient Infrastructure and Communities (BRIC) grant program.
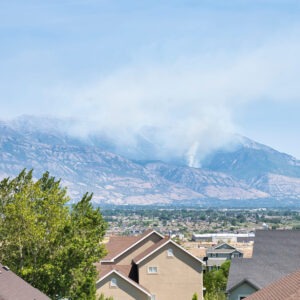
An independent analysis by Headwaters Economics shows that the first round of funding from the Community Wildfire Defense Grant program prioritized high-risk, low-income communities.

Many federal grant programs require communities to provide a local match, creating barriers for rural and underserved places.