Correction on November 27, 2024: This post has been updated to correct a data error and related misstatement. Low-capacity communities were more successful than high-capacity communities at securing CWDG funds, not less successful.
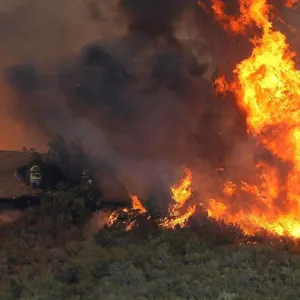
The 2021 Bipartisan Infrastructure Law included the most substantial funding for wildfire resilience ever seen in the United States. Among the $5 billion for federal wildland fire management efforts is a new $1 billion program designed to help at-risk communities and Tribes plan for and reduce wildfire risk—the Community Wildfire Defense Grant (CWDG) program.
Administered by the U.S. Forest Service, CWDG is a competitive grant program. Funded activities can include the development of Community Wildfire Protection Plans (CWPPs), training and equipment, staffing, home assessments, vegetation management (including prescribed fire and defensible space), and other activities on non-federal land. Grants cannot be used for home hardening activities, such as retrofitting roofs or vents to make them wildfire-resistant.
Congress directed the U.S. Forest Service to prioritize grants to communities that meet three primary criteria: high wildfire risk, low income, and impacted by severe natural disasters. The first round of funding, announced in March 2023, awarded $197 million.
At the request of the U.S. Forest Service, Headwaters Economics independently analyzed the March 2023 grant awards. Overall, we found that the first round of CWDG grants prioritized low-income, high-risk communities, and low-capacity places. Key findings are summarized below. The full report includes additional detail, including data tables and information about reviewer scores.
Requests outstripped available funding at a rate of 3 to 1
CWDG proposals were received from 35 states and Puerto Rico. Demand outstripped available funding at a rate of 3:1. In the first round, more than $524 million was requested in 416 proposals. The 99 proposals selected for funding totaled approximately $179 million. This indicates a strong need for more wildfire resilience funding. (The totals included in this analysis differ slightly from the Forest Service’s March 2023 announcement; see Methods & Data Sources for more information.)
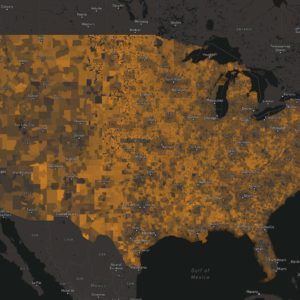
Detailed tables with the number, types, and dollar amount of all proposals by state and U.S. Forest Service Region can be found in the full report. Explore all proposals in the interactive map below.
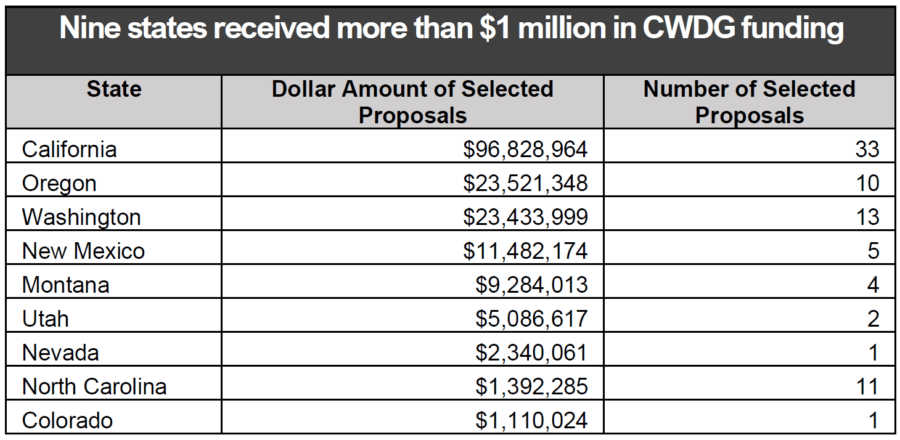
The states with the most funding awarded are primarily in the West, except North Carolina. As shown in the table below, nine states were awarded more than $1 million in grants.
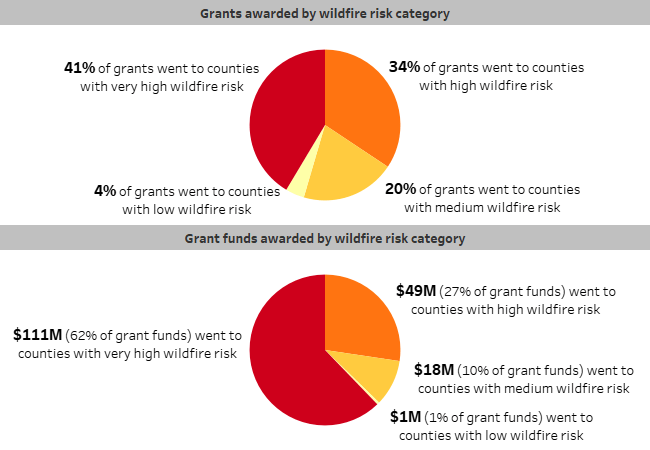
Communities with high wildfire risk received 89% of the funding
All CWDG funding went to communities that self-identified as having high or very high wildfire risk. Applicants were allowed to use local and state data to quantify wildfire risk in their proposals. However, when viewed at the national scale, a proposal’s risk level may not be as severe. We used the national “Risk to Homes” dataset from the U.S. Forest Service’s Wildfire Risk to Communities project to examine national risk rankings for proposals (see more in Methods and Data Sources below).
Three-quarters of grants and 89% of funding were awarded to communities with national risk rankings of high and very high. A small share of grants (24%) and funding (11%) were awarded to communities with low or medium national risk.
Communities with very high wildfire risk also had the highest rate of success: 28% of applications from very high-risk communities were selected compared to just 9% of applications from low-risk communities.
There may be legitimate reasons for funding wildfire grants in locations with low wildfire risk on a national scale. The national data could be incorrect; national datasets can be too coarse and lack local calibration. Allowing communities to use local data allows communities the flexibility to demonstrate their risk using local knowledge. However, communities with their own datasets are often higher capacity. Allowing applicants to use local data may exacerbate barriers faced by low-capacity communities.
Low-income and disadvantaged communities received more than 90% of the funding
Low-income and disadvantaged communities received the majority of grants and had higher success rates in securing CWDG grants. In the first funding cycle, 85% of grants went to low-income counties, as determined by the CWDG criteria. Just 14 grants totaling $13 million (7% of the funding) were awarded to communities that did not meet the CWDG “low-income” criteria.
The Climate and Economic Justice Screening Tool (CEJST)—created by the Biden-Harris Administration to identify “disadvantaged” communities—provides slightly different definitions of “low-income” and “disadvantaged” (see Methods & Data Sources below). When the CWDG awards are compared using these definitions, the outcomes remain strong: 91% of grants were awarded to CEJST “low-income” communities and 94% of grants were awarded to CEJST “disadvantaged” communities.
In addition, success rates for low-income and disadvantaged communities were higher than other proposals. More than half (52%) of the proposals that self-identified their communities as “low income” were selected, compared to just 6% of proposals from other communities.
Low-capacity communities were more successful in securing grants
Communities have different capacities to apply for and secure federal grant funding and there is a history of low-capacity places missing out on funding opportunities. This analysis shows that CWDG applications from low-capacity communities—those without key local government positions, expertise, or resources—had relatively higher rates of success and received more grants (see Methods and Data Sources and the Rural Capacity Index). Proposals from low-capacity communities were selected 36% of the time, while proposals from high-capacity communities were selected 19% of the time.
This indicates that the Forest Service was somewhat successful overcoming barriers faced by low-capacity communities that hope to compete for federal funding. These barriers can include a lack of administrative and technical staff needed to submit competitive grant proposals and manage complex projects. Further research will be needed to identify how this round of CWDG grants was able to overcome these obstacles, and whether additional assistance may be necessary to help low-capacity communities successfully compete for future grant funding, including project identification, grant writing, and grant administration.
Opportunities to improve the CWDG program
Overall, this analysis finds that the CWDG program is meeting its objectives and prioritizing grants to low-income, high-risk places. This analysis also reveals a few opportunities for improvement in the CWDG program.
First, targeted outreach and technical assistance in future grant cycles could help meet the goals of prioritizing low-income and disadvantaged communities with high wildfire risk. It could also help address the limitations faced by low-capacity communities. A forthcoming analysis from Headwaters Economics will help identify communities that may need technical assistance to succeed in securing CWDG grants.
Second, proposal data alone cannot illuminate all opportunities to improve the CWDG program. While this analysis highlights important outcomes from the first round of CWDG funding, it was based entirely on proposal data. Beyond looking at the proposals, the U.S. Forest Service has also conducted several listening sessions to gather direct input from applicants and reviewers. Responding to this feedback will be fundamental to continuing to improve the CWDG program.
Finally, this analysis is limited by the scale of available data. Projects were assigned to a county even though some projects may affect only a portion of a county. In future funding cycles, finer-scaled data about project impacts—coupled with finer-scaled data identifying low-income or disadvantaged communities—could facilitate a more refined analysis.
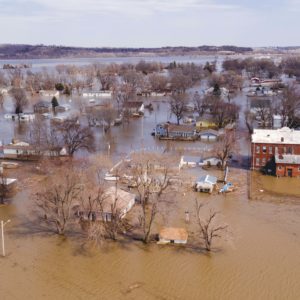
The CWDG program is an important investment in community wildfire resilience. As wildfires increase in intensity and frequency, programs like CWDG will be in even higher demand. The need for funding to support community wildfire resilience—including for activities like home hardening, which is not currently funded by CWDG—will only grow. Continued efforts are necessary to ensure that federal programs for wildfire resilience are used for effective risk-reduction strategies and prioritize the most at-risk people and places.
Methods & Data Sources
For complete methods, see the full report.
The U.S. Forest Service provided Headwaters Economics with a dataset for all 2022 CWDG applications (“CWDG Dataset”). The CWDG Dataset included information provided by the applicant (including latitude/longitude, project name, grant request amount, and scoring prioritization criteria for low income, wildfire hazard potential, and severe natural disasters); the type of application (CWPP or project); reviewer scores; and whether the application was selected.
The data included in this analysis differ slightly from the Forest Service’s March 2023 announcement. The Forest Service announced $197 million was awarded in 100 grants. However, it was later discovered that one project from Washington state was double counted. That project has been removed from this analysis. Additionally, the $197 million figure includes approximately $18 million granted to states for indirect costs to support program administration. Indirect costs were excluded from this analysis.
Headwaters Economics georeferenced each application based on applicant-provided latitude and longitude and paired the CWDG Dataset with additional data sources, as described below.
Scale of analysis and georeferencing
This analysis was conducted at the county scale because CWDG applications varied greatly in their scope and it was not feasible to determine whether applications were proposed at the sub-county level. One application from Puerto Rico was not selected for funding and was excluded from the analysis.
In order to conduct the analysis, Headwaters Economics first assigned each application to a county based on the applicant-supplied latitude and longitude. Some proposed projects are likely to impact more than one county, but each application was only assigned to a single county. Typos in the latitude/longitude for a small number of applications were manually corrected.
Additional Data Sources
National wildfire risk data are from the “Risk to Homes” dataset in the Wildfire Risk to Communities project. Applications in counties where the “Risk to Homes” national percentile rank is >70 are considered “high or very high” national wildfire risk.
Self-identified low-income data are from the dataset provided for the first round of CWDG applications.
CEJST “disadvantaged” and “low income” are from the Climate and Economic Justice Screening Tool, version 1.0 (2022). Applications in counties where at least one census tract is categorized as “disadvantaged” or “low income” by CEJST were considered “disadvantaged” or “low income” for the purposes of this analysis.
The Rural Capacity Index is from Headwaters Economics, A Rural Capacity Map (2021). The Rural Capacity Index is a measure of whether communities have the staffing and expertise to support infrastructure and climate resilience projects and comprises 10 indicators. Counties are categorized as “low capacity” if their index score ranks in the lower 33% of counties nationwide.
Acknowledgments
Headwaters Economics conducted this independent analysis at the request of the U.S. Forest Service. Brad Simpkins, Tim Melchert, and Jim Menakis with the U.S. Forest Service contributed technical expertise to this research. For more information about the CWDG program, please visit the Community Wildfire Defense Grant webpage or email SM.FS.usfs_cwdg@usda.gov.