

Neighborhoods at Risk is an easy-to-use website with interactive maps, charts, and resources to help communities identify neighborhoods that may be especially vulnerable to wildfire, flooding, and extreme heat of climate change.
It is free to use and available for every community, county, and state in the nation.
Neighborhoods at Risk supports:

Elected Officials

Planners

Climate Practitioners

Advocates
What can you do with Neighborhoods at Risk?
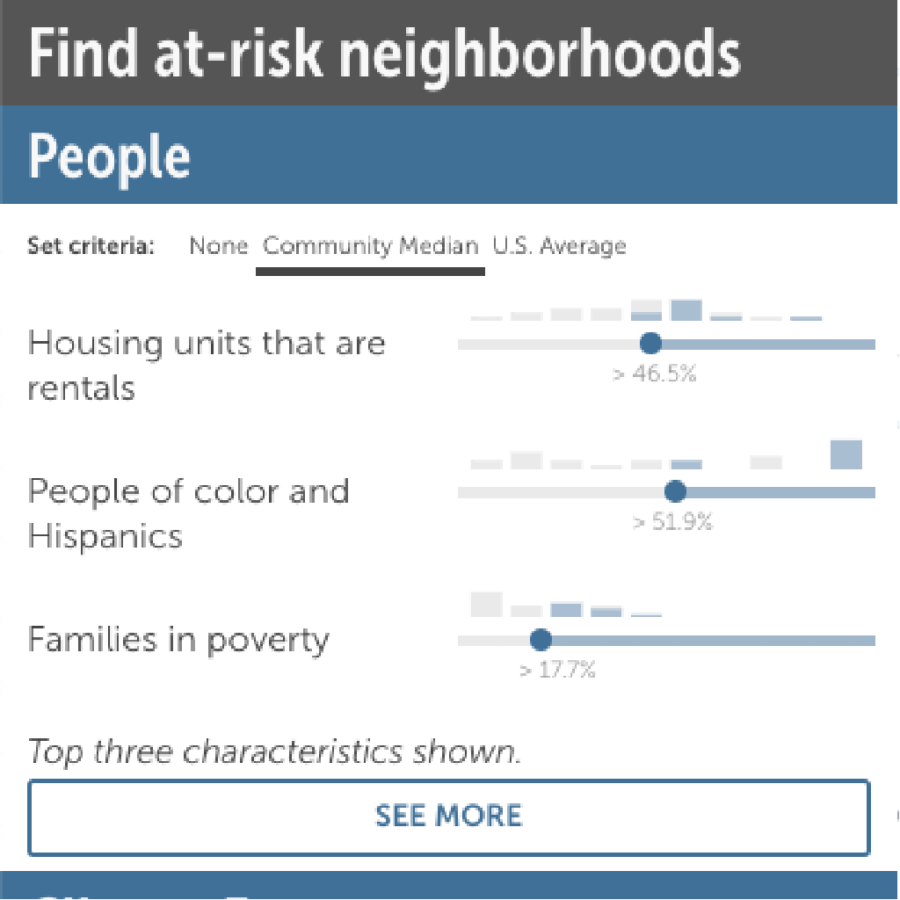
Find At-Risk Neighborhoods
Learn where risk is highest
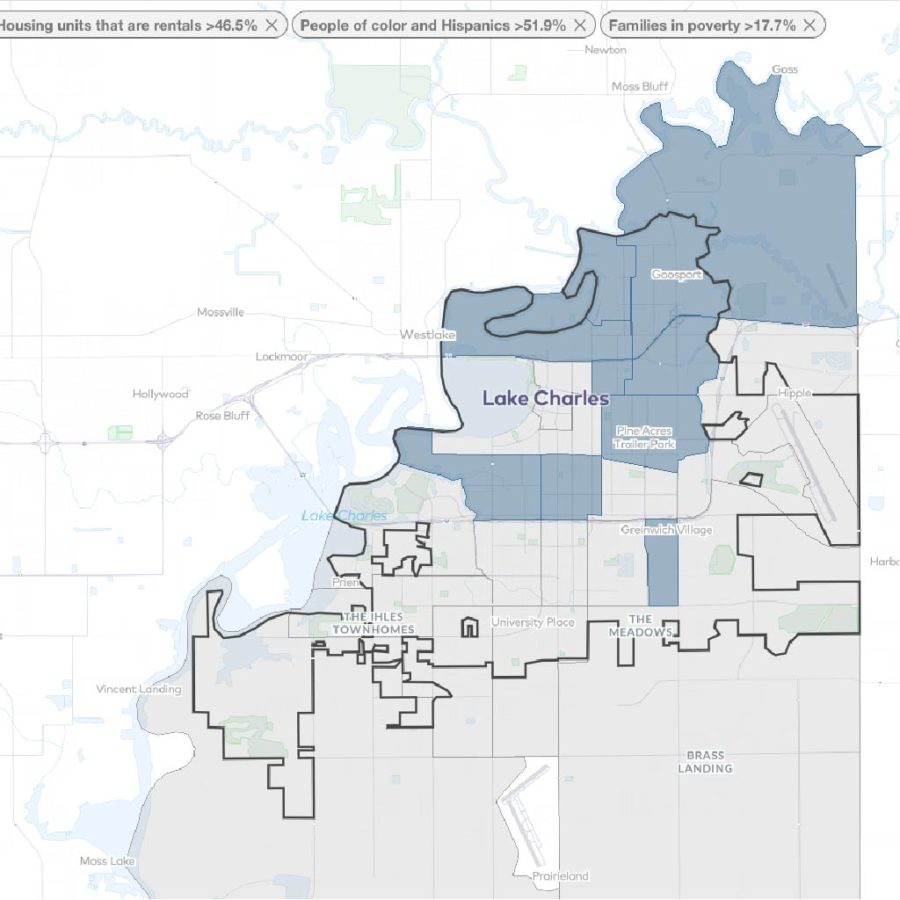
Customize your map
Get population summaries
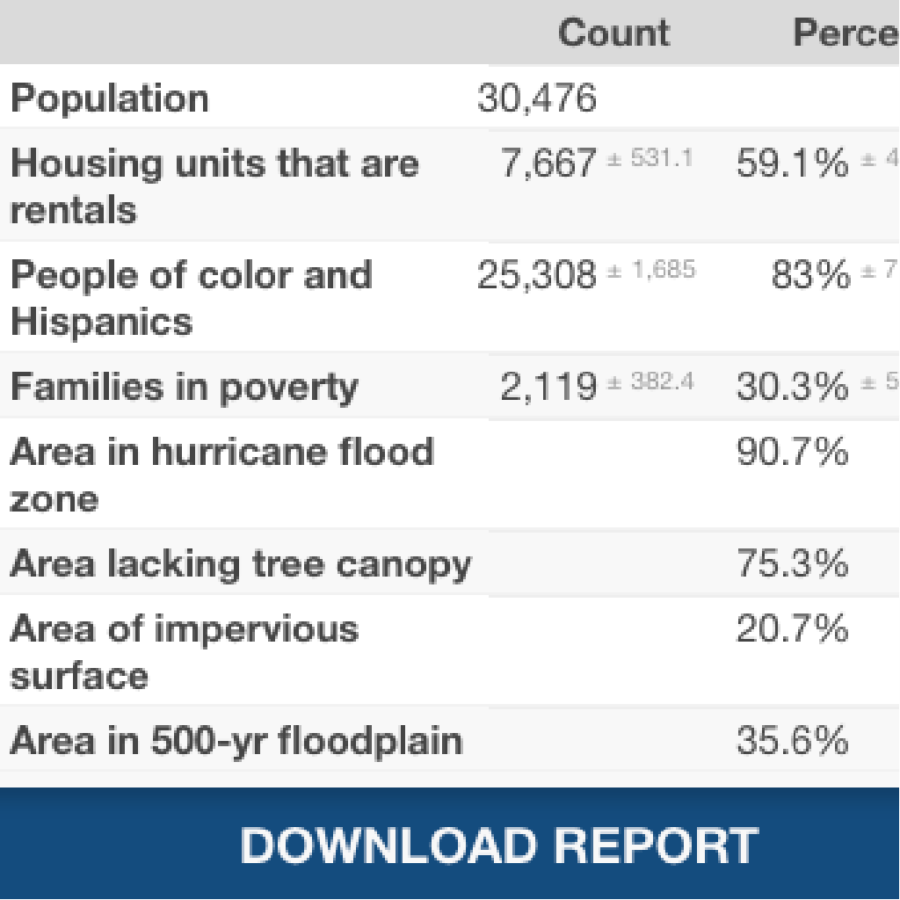
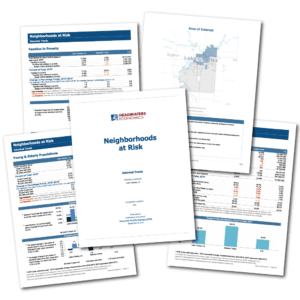
Download a PDF report
Explore Climate Projections
Access community-specific climate data
Easily adjust the time period, temperatures and precipitation settings.

Advantages
- Free, friendly, intuitive interface
- Displays top vulnerabilities for your community
- Brings together data about people and climate exposure
- Continuously updated data
Limitations
- Not a replacement for state, local, or individual property assessments
- Works best for communities with more than 1,000 people
Data sources
Demographics, poverty, and housing characteristics are from the U.S. Census Bureau’s American Community Survey. Wildfire risk data are from the U.S. Forest Service, Wildfire Risk to Communities. Flood data are from FEMA. Extreme heat data are from the National Land Cover Dataset. Climate projections are from the Applied Climate Information System managed by the Northeast Regional Climate Center at Cornell University.
Special thanks
This free tool is nationally available thanks to the generous support of the U.S. Forest Service, Tableau Foundation, Mapbox, Urban Sustainability Directors Network, M. J. Murdock Charitable Trust, Climate Resilience Fund, National Oceanic and Atmospheric Administration, and National Academy of Sciences, Engineering, and Medicine.
Frequently Asked Questions
What is Neighborhoods at Risk?
Neighborhoods at Risk is a free, interactive data tool that provides neighborhood-level (by census tract) information about potentially vulnerable people and climate change. The tool allows users to filter and explore census tracts based on 13 socioeconomic and climate exposure variables. It also provides climate projections for changes in temperature and precipitation for the selected location. Users can download customized reports showing socioeconomic data for selected census tracts.
What data are used in Neighborhoods at Risk and how often are they updated?
People. Neighborhoods at Risk uses census tract-level socioeconomic data from the latest release of the U.S. Census American Community Survey (ACS) 5-year estimates. Headwaters Economics updates Neighborhoods at Risk with newly released data from the U.S. Census Bureau’s American Community Survey within 90 days after data publication. This page shows the update frequency and timing.
Neighborhoods at Risk displays nine socioeconomic variables and filters about people. For each characteristic, the tool provides a margin of error as reported by the Census. Data include:
- Children under 5 years old
- Families in poverty
- Households with no car
- Housing units that are rentals
- Housing units that are mobile homes
- People of color including Hispanics
- People over 65 years old
- People who don’t speak English well
- People with disabilities
- People without health insurance
Climate exposure. Neighborhoods at Risk uses national data to calculate the area in each census tract with exposure to different climate-related hazards. The climate exposure variables are:
- Wildifre: Homes exposed. The percentage of homes with direct or indirect wildfire exposure in tracts with moderate or higher wildfire risk. “Moderate or higher” wildfire risk is defined as having greater than or equal to the 40th percentile national rank of “Housing Unit Risk.” Data are from the U.S. Forest Service, Wildfire Risk to Communities.
- Flood: Area in floodplain. The percentage of tract area that intersects with the 500-year floodplain, which includes all 100-year floodplain areas. Data are from FEMA.
- Heat: No tree canopy. The percentage of tract area lacking tree canopy shade. Data are based on remotely sensed, 30-meter tree canopy estimates from 2021 via the National Land Cover Dataset, housed by the Multi-Resolution Land Characteristics Consortium. For Hawaii estimates from 2016 are used.
- Heat: Impervious area. The percentage of tract area covered by impervious surfaces like roofs, roads, and parking lots. Data are based on remotely sensed, 30-meter urban impervious surfaces from 2021 via the National Land Cover Dataset, housed by the Multi-Resolution Land Characteristics Consortium. For Hawaii estimates from 2001 are used.
Climate projections. Neighborhoods at Risk uses climate projection data from the Northeast Regional Climate Center’s Applied Climate Information System representing LOCA Scenarios developed for the Fourth National Climate Assessment. There are four climate projections variables:
- Days per year above 90°F/95°F/100°F.
- Average annual temperature.
- Days per year with precipitation above 1″/2″/4″.
- Average annual precipitation.
Precipitation includes rainfall and snowfall equivalent. As a rule of thumb, ten inches of fallen snow is estimated to contain roughly one inch of water, but this number can vary greatly depending on snow density.
How should I cite data from Neighborhoods at Risk?
People
To cite data about people and socioeconomic conditions found in the Neighborhoods at Risk web application and report, Headwaters Economics recommends that you use the following citation:
U.S. Department of Commerce. 2024. Census Bureau, American Community Survey Office, Washington, D.C., as reported by Headwaters Economics’ Neighborhoods at Risk. Retrieved [date] from https://apps.headwaterseconomics.org/neighborhoods-at-risk/
Climate Exposure
To cite climate exposure data found the Neighborhoods at Risk web application, Headwaters Economics recommends that you use the following citations:
Wildfire: Homes exposed
USDA Forest Service. (2024). Wildfire Risk to Communities. https://wildfirerisk.org, as reported by Headwaters Economics’ Neighborhoods at Risk. Retrieved [date] from https://apps.headwaterseconomics.org/neighborhoods-at-risk/
Flood: Area in floodplain
FEMA National Flood Hazard Layer (NFHL). (2026). Flood Risk Database (FRD) Technical Reference https://www.fema.gov/national-flood-hazard-layer-nfhl, as reported by Headwaters Economics’ Neighborhoods at Risk. Retrieved [date] from https://apps.headwaterseconomics.org/neighborhoods-at-risk/
Heat: No tree canopy and Heat: Impervious area
Homer CG, Dewitz JA, Jin S, Xian G, Costello C, Danielson P, Gass L, Funk M, Wickham J, Stehman S, Auch RF, Ritters KH. (2020). Conterminous United States land cover change patterns 2001–2016 from the 2016 National Land Cover Database. ISPRS Journal of Photogrammetry and Remote Sensing, 162, 184-199, at https://doi.org/10.1016/j.isprsjprs.2020.02.019, as reported by Headwaters Economics’ Neighborhoods at Risk. Retrieved [date] from https://apps.headwaterseconomics.org/neighborhoods-at-risk/
Climate Projection
To cite climate projection data found in the Neighborhoods at Risk web application, Headwaters Economics recommends that you use the following citations:
Northeast Regional Climate Center. (n.d.). Applied Climate Information System (ACIS). Ithaca, NY: Cornell University. Retrieved from http://rcc-acis.org
DeGaetano AT, Noon W, Eggleston KL. (2015). Efficient Access to Climate Products using ACIS Web Services. Bulletin of the American Meteorological Society, 96(2), 173-180. Retrieved from http://journals.ametsoc.org/doi/10.1175/BAMS-D-13-00032.1
Why are these “People” and “Climate Exposure” characteristics included?
The nine characteristics and filters included under “People” in Neighborhoods at Risk are indicators of populations that are potentially more vulnerable to climate risk and climate-related disasters. Not all people who fit these criteria are more vulnerable, but research shows that these populations are, on average, more likely to experience difficulty during all phases of climate-related disasters including:
- Mitigation: reducing the potential risk
- Preparedness: getting plans and resources ready
- Response: protecting and rescuing
- Recovery: rebuilding
The downloadable Neighborhoods at Risk report provides detailed information and references documenting how each variable is associated with potentially higher risk to climate change.
The characteristics and filters included under “Climate Exposure” in Neighborhoods at Risk are indicators of land area that may experience more significant impacts from climate change. These variables represent characteristics of our physical environment that make us more or less vulnerable to climate change by affecting the likelihood of wildfire, flood, and extreme heat events.
How are the top three “People” characteristics selected?
When you first view Neighborhoods at Risk, the application shows only the three “People” variables that are most significant for the selected place. To identify the top three variables, all nine “People” variables are ranked against all other places in the United States. By default, the tool will show only the three that rank highest for the selected location, but users can change these variables by selecting the “see more” button. To account for ties in ranks and locations with missing data, the ranks are normalized by dividing by the maximum rank for that variable across the entire U.S.