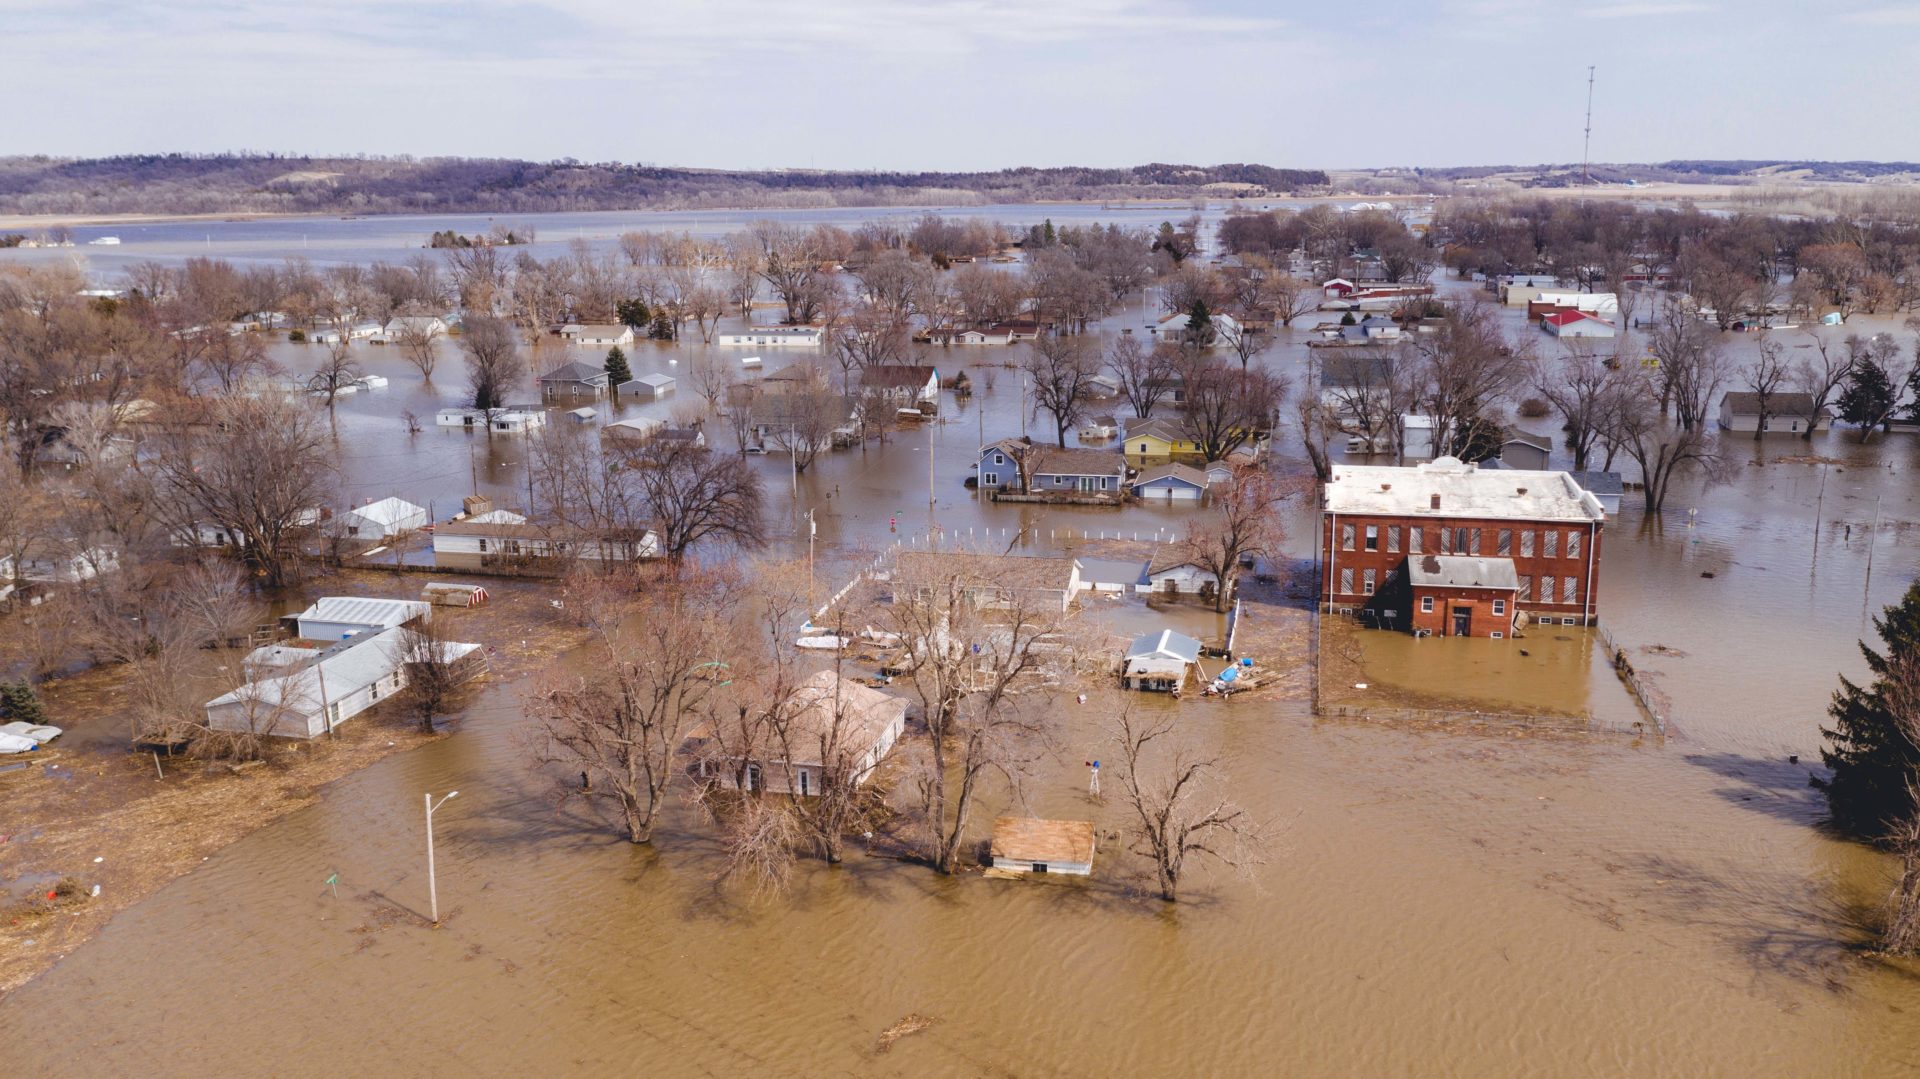
This month the Federal Emergency Management Agency (FEMA) announced the second round of funding from its Building Resilient Infrastructure and Communities (BRIC) program, which supports projects across the United States that reduce natural disaster risks and build climate resilience.
BRIC stands out for its significant and increasing funding levels – set to double next year to $2.3 billion – as well as its commitment to both disaster resilience and equity. However, previous analysis has shown that BRIC’s emphasis on equity has proven difficult to realize. In the program’s inaugural year (fiscal year 2020), 94% of BRIC grants went to coastal states and wealthier counties. Communities that lacked capacity—staffing, resources, and expertise—failed to compete successfully for the grants.
Solving the equity challenge may be beyond the scope of a single agency or funding program, but BRIC’s requirements and selection processes do play a role. As BRIC prepared for its second year, FEMA demonstrated a commitment to improving outcomes. In this analysis, we evaluate the geographic distribution of the new FY2021 allocations. We find that while equity outcomes have improved, there are still opportunities to improve FEMA’s flagship funding program for disaster risk reduction and climate adaptation.
Subscribe to our newsletter!
Interior gains funding but east and west coasts still dominate
For this latest round (FY2021), BRIC had $1 billion available for three pools of funding: a national competition grant, state allocations, and funding set aside for tribes. FEMA selected 53 projects in the national selection and 316 projects in the state allocation and tribal set-aside funding pools for further review. (These allocations are not final decisions. Funding is contingent on finalizing reviews, securing permits, and completing changes that FEMA requests.)
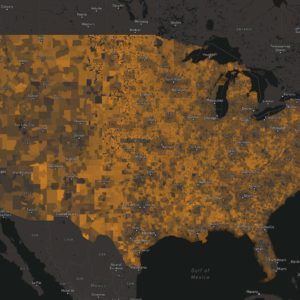
This year’s funding recommendations have a noticeably different geographic footprint when compared to last year’s decisions. As noted by FEMA, 19 states received funding in the national competition, up from 10 states in the previous year. The interactive maps below illustrate changes in the distribution of funding for projects allocated $20 million or more.
While the interior states received more funding this year, states on the east and west coasts are still the largest benefactors, securing 80% of total BRIC funds for FY2021. Further, the increased funding that went to the interior was largely driven by investments in only two states: Utah and Oklahoma account for 75% of the funding that went to the interior.
This year the top three states – California, Utah, and New York – are poised to receive 47% of BRIC’s total funding. This is an improvement from last year, when the top three states (California, Washington, and New Jersey) received 59% of funding. Nonetheless, it still demonstrates that relatively few states continue to capture the majority of BRIC funding.
On the one hand, BRIC was designed to fund large-scale, visionary projects, so predictably the funding distributions are concentrated in specific places. On the other hand, these types of projects are harder for rural communities and regions to coordinate, plan, and implement. The consolidation demonstrates that FEMA still needs to grapple with tradeoffs related to project prioritization, impact, and scale so as not to leave behind rural communities.
Capacity limits access to BRIC funding
States and communities have different capacities in their ability to apply for and secure BRIC funding. In the graph below, we compare Rural Capacity Index scores to states with BRIC applications that were selected for further review. States with higher-capacity places—those with key local government positions and expertise—were more likely to have successful applications.
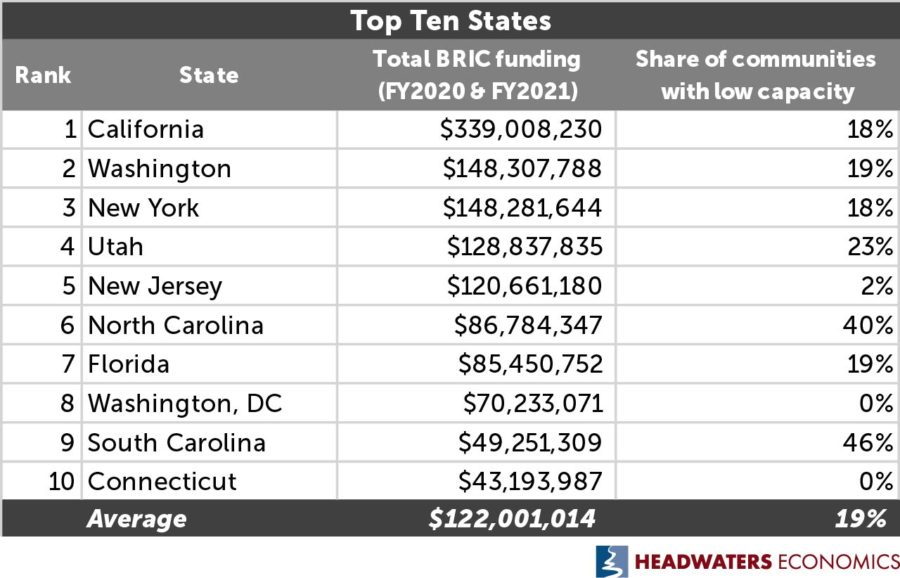
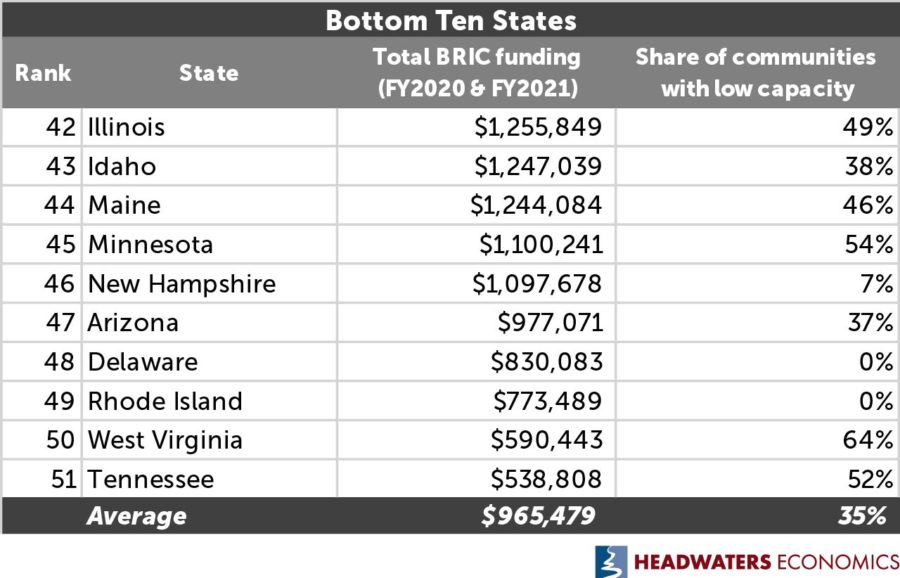
There are substantial differences in capacity scores between the 10 states that received the most BRIC funding (cumulatively in FY2020 and FY2021) and the 10 states that received the least, as shown in the tables below.
The analysis includes all 50 states and Washington, D.C., but not U.S. territories. In order to compare funding between the two years, all dollars have been adjusted for inflation and reflect 2021 dollars.
The interactive chart below shows the total BRIC funds captured by each state.
Continuing to improve outcomes and equity
FEMA has demonstrated a commitment to improving socioeconomic and geographic equity outcomes.
While expectations for BRIC across federal agencies and state and local governments remain high, the magnitude of need far exceeds the availability of funds. For example, Headwaters Economics found that over $6 billion is needed just to retrofit existing wood roofs in areas of high wildfire risk. Proposals to BRIC amounted to more than four times the $1 billion of funding available in FY2021.
Importantly, increasing funding alone will not create widespread resilience. As noted above, many communities do not have the capacity to secure FEMA funding or implement projects to reduce disaster risk. Legacies of disinvestment and outdated fiscal policies create barriers to change that are hard to overcome without targeted programs and policy changes.
To help ensure that limited funding is allocated to the communities that need it most and not simply to the communities with the greatest capacity to develop competitive proposals, FEMA can implement strategies to streamline the application process and help build capacity. The suggestions here could improve outcomes for BRIC funding and can also be applied to other federal funding streams.
Streamline the application process to overcome capacity barriers.
BRIC’s application requirements and scoring criteria disadvantage certain geographies, particularly rural regions, places with lower incomes, and lower-capacity communities. Improvements to the application and scoring process can help reduce these barriers.
Examples of problems and solutions to the program include:
| Problem | Solution |
|---|---|
| Local match requirements are too expensive for many communities. Applicants receive extra points in the scoring for providing a 30% match, rewarding communities that already have more resources. | Other federal agencies are finding ways to reduce the barriers of local match, even when required by statute. FEMA could waive local match requirements and expand definitions for in-kind contributions (e.g., allowing a project’s long-term maintenance expenses to count). |
| Benefit-cost analysis prioritizes projects in communities with higher property values, reinforcing inequities. | Prioritize equity and de-emphasize benefit-cost analysis in the application process. Reinterpret the Stafford Act’s “cost effective” requirement more holistically or work with OMB on new formulas that prioritize safety as opposed to property values. |
| Scoring processes reward places with building codes, reducing options for funding critical projects in communities where implementing building codes is less politically or financially feasible. | Eliminate or de-emphasize building codes in the scoring criteria. Instead, provide support for customized technical assistance that helps communities adopt building codes. |
| National competition pits high-capacity, urban centers against rural and remote communities that may have fewer resources, staff, and time to complete complicated applications. | Shifting more money into the state allocation and tribal-set-aside pools could increase geographic equity while funding smaller, high-impact projects that create community-wide benefits. The competitive national program can also be stratified to ensure more funding reaches rural communities and interior states. |
Build capacity with structural improvements
Strategic capacity investments are needed to improve the long-term trajectories of places that would otherwise be left behind. BRIC and other federal funding programs can be used to build local capacity instead of simply rewarding places that already have it.
Examples of capacity-building strategies include:
- Support technical assistance. Investments in technical assistance and partnerships can help address capacity issues at the local and state levels. Technical assistance should include help with grant writing, project scoping and plan development, and coordination among local, state, and federal stakeholders.
- Promote multi-jurisdictional projects. Funding regional projects that leverage urban-rural partnerships can benefit low-capacity communities. Investing in regional institutions and organizations that can help coordinate resources and prioritize projects may also be necessary.
- Incentivize economic diversification. Low-capacity communities are often economically dependent on farming and other natural resource sectors associated with volatile revenue. By prioritizing projects that result in economic diversification, BRIC and other federal funding programs can help communities generate predictable local revenue needed to maintain infrastructure and adaptation projects. Through eligibility and scoring criteria, FEMA can further encourage projects that create long-term economic benefits through new jobs, affordable housing, and local amenities like outdoor recreation.
As one of the largest U.S. grant programs dedicated to resilience, BRIC – and FEMA as its managing agency – has a unique opportunity to continue deepening investments in resilience for the places that need it the most. FEMA already has community-based staff members and teams focused on interagency coordination, and expanded BRIC funding means more places will have access to resources. In the next round of funding, structural changes to the application process can help build capacity and invest in communities.
Data sources and methods
Data Sources
BRIC application and funding data are from FEMA for both fiscal years 2020 and 2021. Data include the state allocations, tribal set-aside, and national competition applications. Data do not include the U.S. territories.
To compare funding between the two years, all dollars have been adjusted for inflation and reflect 2021 dollars.
Data about community capacity is from Headwaters Economics’ Rural Capacity Map.
Proposals to BRIC funded through Flood Mitigation Assistance
This analysis does not include proposals funded by FEMA’s Flood Mitigation Assistance (FMA) program. FMA grants are released at the same time as BRIC grants. Many communities apply to both BRIC and FMA programs using the same application. If a project is selected, FEMA decides which funding pool to use. FMA grants totaled $160 million for FY2021. The top five recipients of FMA grants were Louisiana ($60.8 million), Texas ($56.1 million), New Jersey ($21.9 million), Montana ($4.6 million), and Kentucky ($4.3 million).