A Rural Capacity Map
To help identify communities where investments in staffing and expertise are needed to support infrastructure and climate resilience projects.
NEW & IMPROVED! Data updated February 2025.
The Rural Capacity Map was updated in February 2025 to reflect the latest data. Methods were updated to add weights for different categories of capacity.
The Infrastructure Investment and Jobs Act is the largest investment in climate resilience in U.S. history. The $1.2 trillion in funding will create transformative opportunities for local governments that own and maintain most of the nation’s infrastructure, but first state and federal agencies must ensure the resources get to the places that need it the most. To help identify communities that need support but may lack staff and expertise to compete for federal funding, we have created a first-of-its-kind Rural Capacity Map.
Why we wrote this:
Money alone cannot create the infrastructure and resilience projects America needs to address climate change. Communities will also need capacity—the staffing and expertise—to apply for and report on federal funding and to identify, design, build, and maintain projects over the long term.
Communities need capacity—the staffing, resources, and expertise—to apply for funding, fulfill complex reporting requirements, and design, build, and maintain infrastructure projects over the long term. Many communities simply lack the staff—and the tax base to support staff—needed to apply for federal programs. Communities that put together applications are often outcompeted by higher-capacity, coastal cities. The places that lack capacity are often the places that most need infrastructure investments: places with a legacy of disinvestment including rural communities and communities of color.
Places that receive the most external funding – whether from state and federal programs or philanthropy – often have larger staff, more expertise, and deeper political influence, not necessarily greater merit. Communities that need the most assistance may be the least likely to even submit applications. For the United States to fully adapt to climate-driven threats and bolster aging infrastructure, its programs and policies must account for community capacity.
Where is capacity limited?
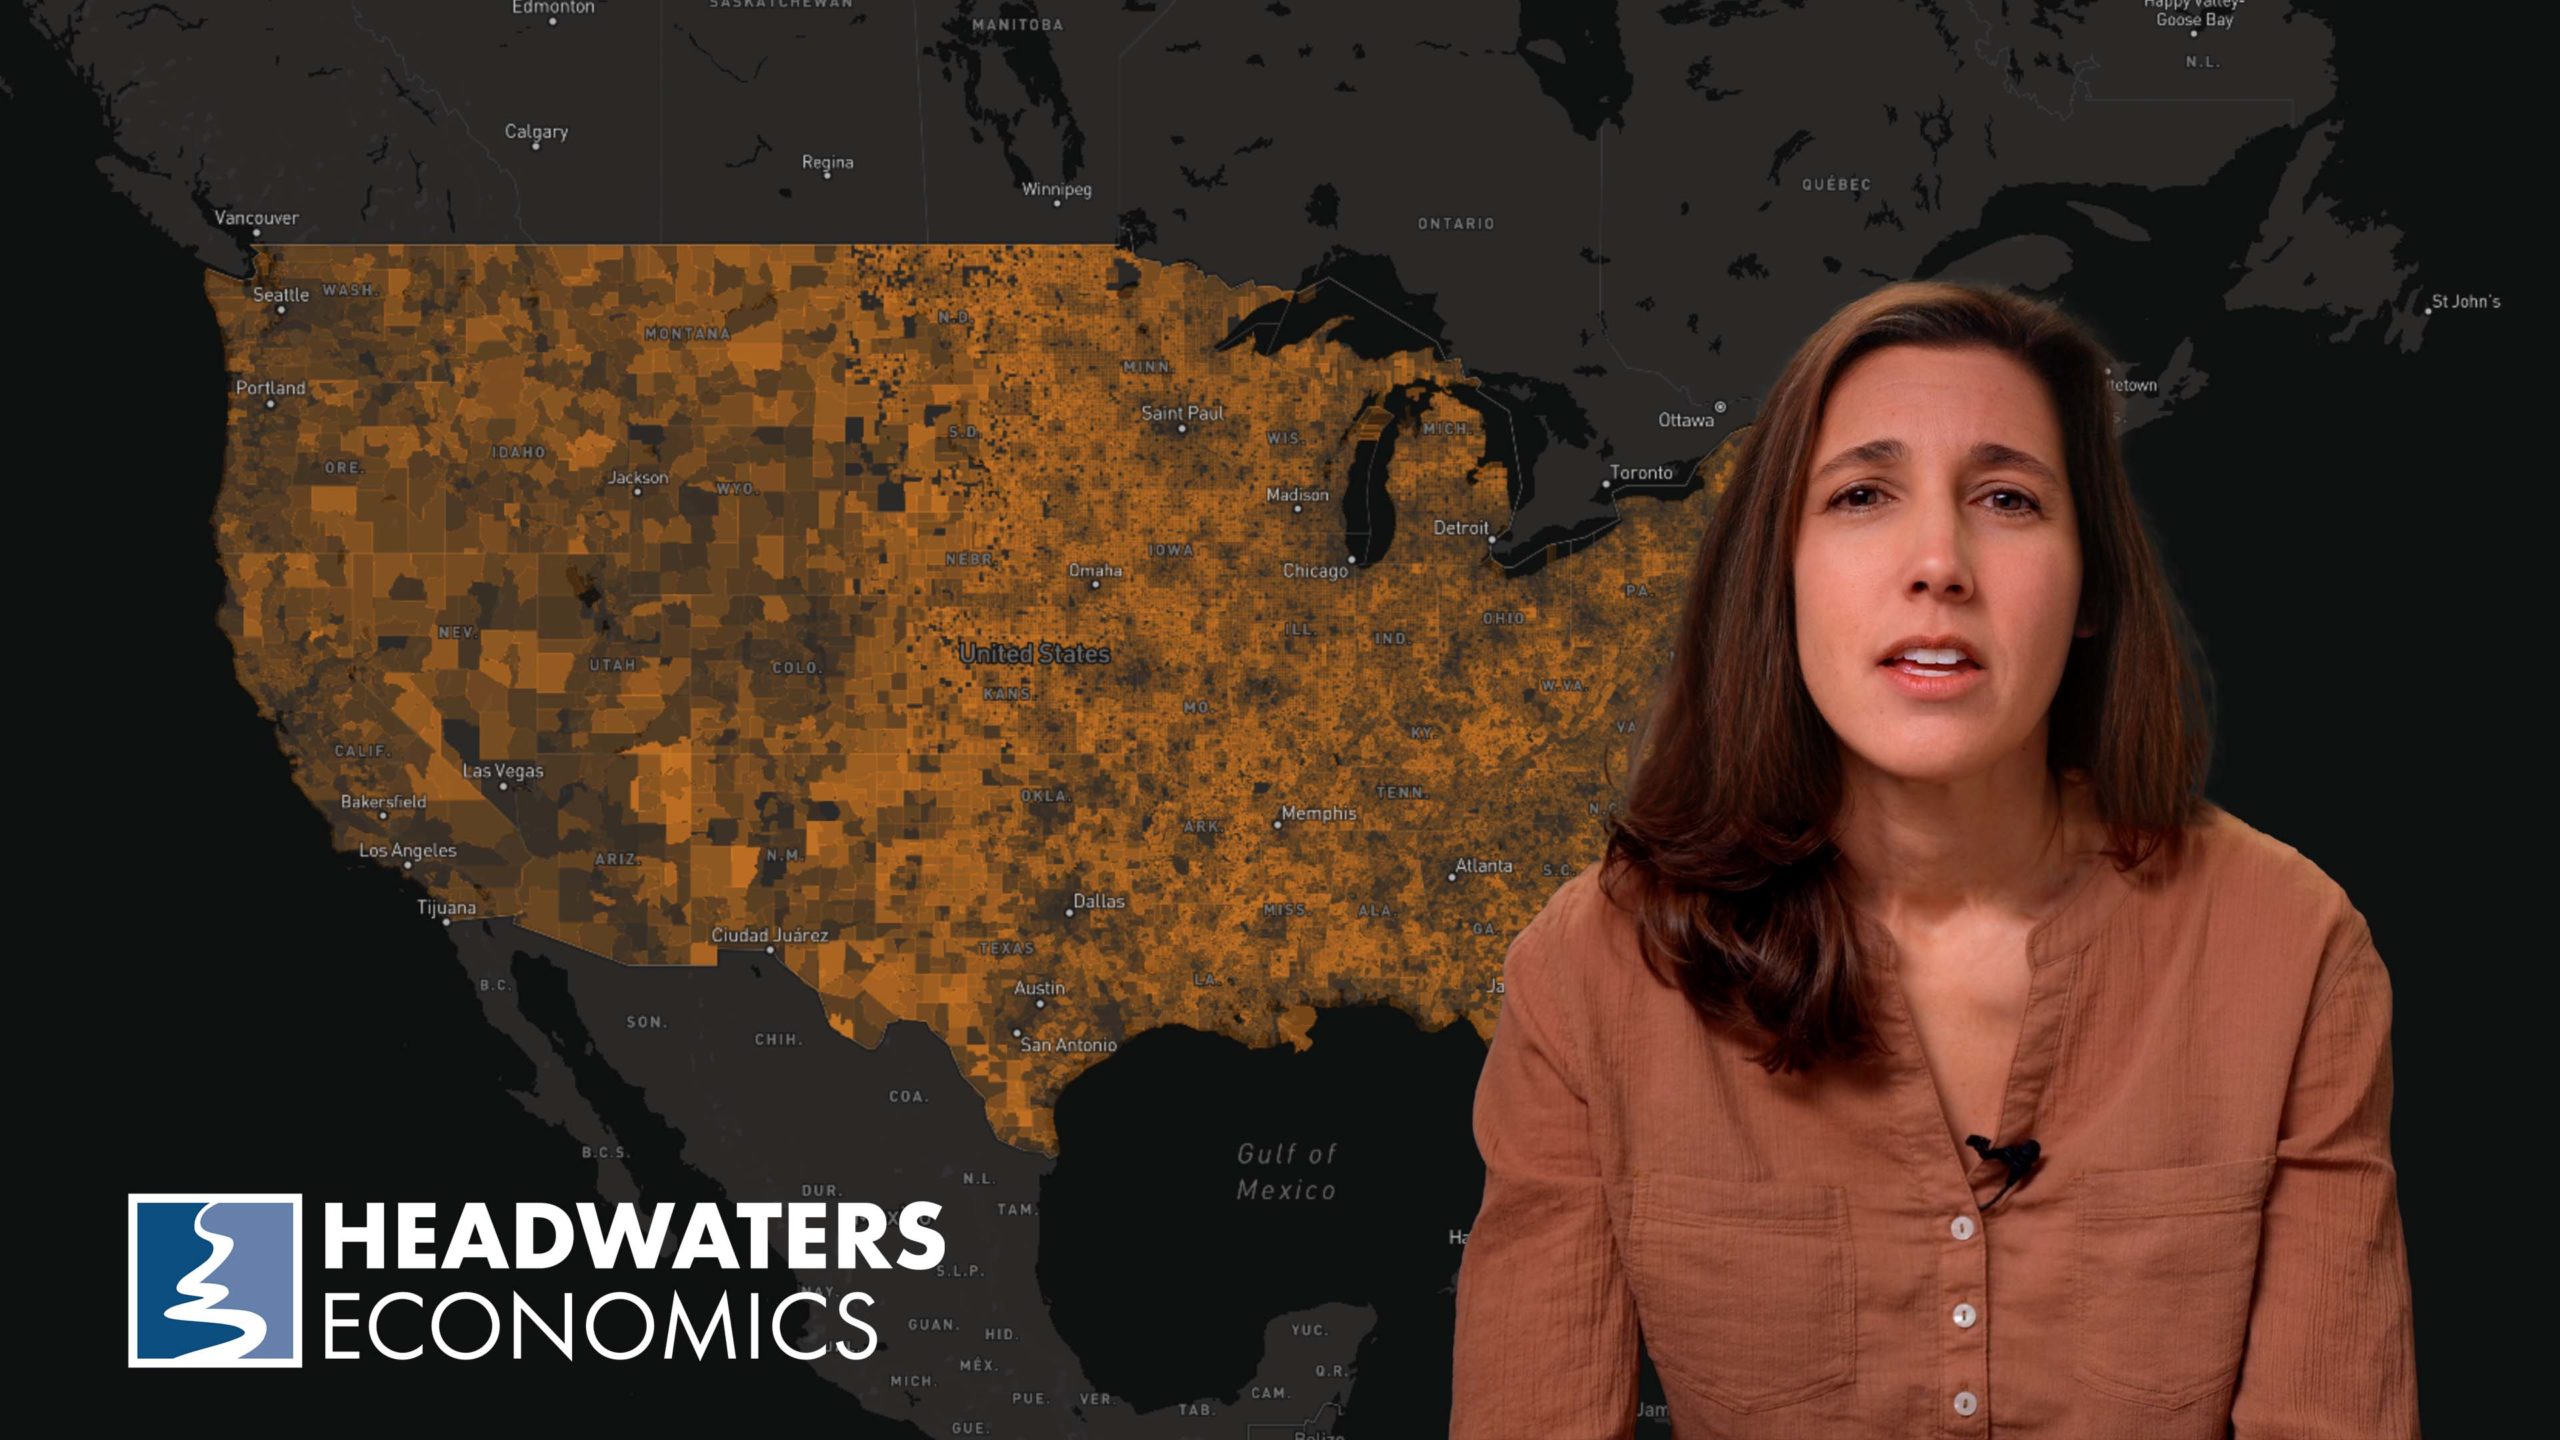
To help identify communities with limited capacity, Headwaters Economics created a new Rural Capacity Index. The Index is based on 12 variables that can function as proxies for community capacity. The variables incorporate metrics related to four categories of capacity: local government staff and expertise, institutional capacity, economic opportunity, and education and engagement. (Read more under Data Sources and Methods below.)
Results are available for counties, county subdivisions, communities, and tribal areas in the interactive map below. The tool displays data across the urban-to-rural continuum to illustrate the variability in community capacity across the country. The inclusion of metropolitan communities is necessary to show the comparatively lower capacity that exists in most rural communities.
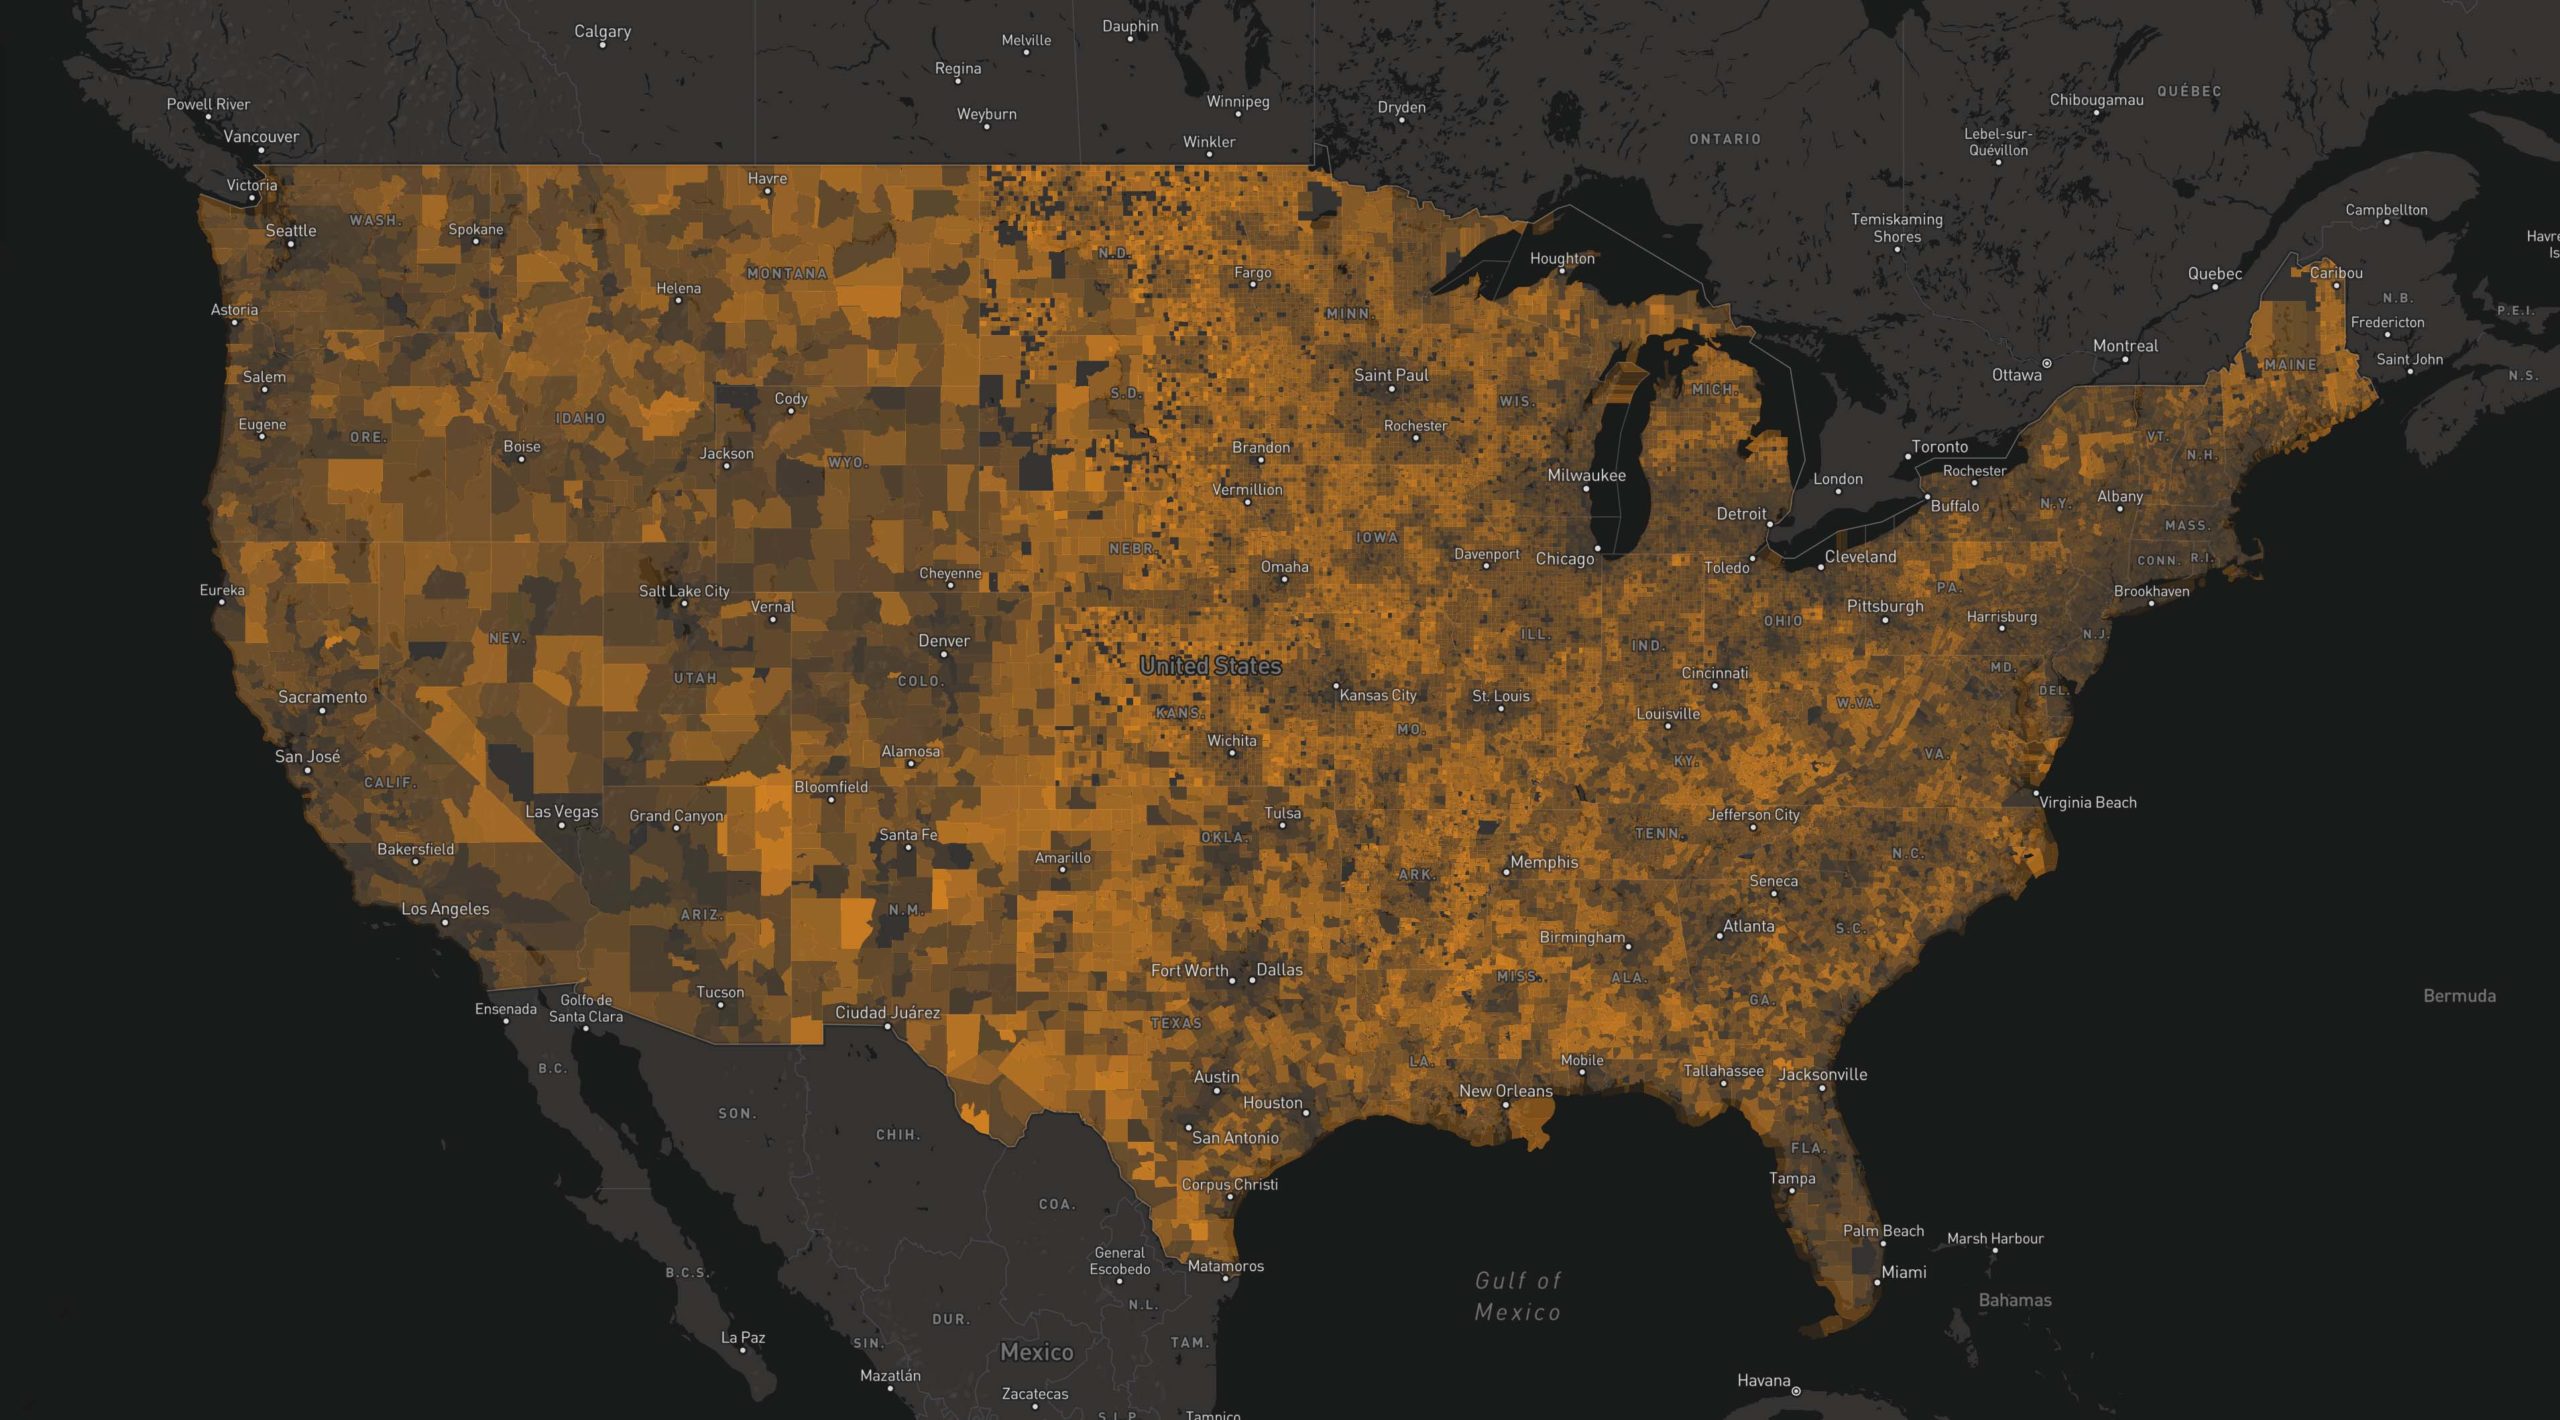
Large portions of the United States have limited capacity.
Integrate the Rural Capacity Index into your own web maps with this ArcGIS Feature Layer.
The Rural Capacity Index demonstrates that large portions of the United States have limited capacity. The Midwest has the most limited capacity (72% of Midwest communities, 75% of Midwest county subdivisions, and 65% of Midwest counties fall below the national median), followed by the West (58% of Western communities, 44% of Western county subdivisions, and 60% of Western counties fall below the national median). Capacity is next lowest in the Gulf Coast and Southeast, and is highest in the Northeast, followed by the Pacific Coast and Great Lakes regions.
The table below shows by region the degree to which communities, county subdivisions, and counties score below the national median in the Rural Capacity Index.
| Communities with Low Capacity | County Subdivisions with Low Capacity | Counties with Low Capacity | |
| Midwest | 72% (4,078) | 74% (7,414) | 65% (447) |
| West | 57% (1,584) | 44% (441) | 59% (166) |
| Gulf Coast | 55% (2,335) | 51% (1,302) | 57% (306) |
| Southeast | 52% (2,128) | 45% (1,797) | 50% (357) |
| Great Lakes | 46% (2,828) | 45% (4,680) | 35% (184) |
| Pacific Coast | 43% (1,351) | 24% (224) | 43% (72) |
| Northeast | 26% (1,463) | 27% (1,605) | 16% (40) |
Sorted by the percent of communities where the Rural Capacity Index is lower than the national median, the 10 states with the most limited capacity are Alaska, South Dakota, North Dakota, West Virginia, Oklahoma, Arkansas, Montana, Mississippi, Nebraska, and New Mexico. Summary statistics by state are available for download in the data spreadsheet.
Subscribe to our newsletter!
Using the Rural Capacity Index
The Rural Capacity Index can be used by communities to advocate for resources. It can also be used by federal and state agencies to more deliberately invest in communities that would otherwise be left behind. In the philanthropic sector, it has been used to direct grants to low-capacity and tribal communities. The Index can be used to target infrastructure investments, including transportation, outdoor recreation, internet access, education, and climate resilience projects. Below, we provide an example of how the Index can be paired with climate risk data to illuminate communities in need of support.
Where do communities with limited capacity face climate-driven threats?
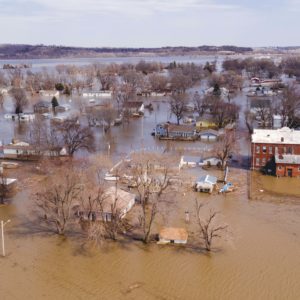
Climate-driven hazards, such as flooding and wildfire, are increasing in severity and intensity and threaten lives, livelihoods, and community stability. Where communities lack capacity and have high threat of flooding or wildfire, funding and strategies for adaptation may be more difficult to access.
Across the country, rural communities with very limited capacity face high risks from climate-driven threats. Of the 7,891 communities with very limited capacity (the lowest-ranked 25% of communities in the U.S.):
- 3,626 (46%) have high flood risk;*
- 3,035 (38%) have high wildfire risk;* and
- 1,534 (19%) have both high flood risk and high wildfire risk.
* High flood risk is defined here as the highest ranked 50% of communities in the U.S. in terms of annual flood exposure according to data published by First Street Foundation. High wildfire risk is defined as the highest ranked 50% of communities in the U.S. according to “Risk to Homes” data published by USDA Forest Service, Wildfire Risk to Communities.
Use the interactive maps below to explore where limited-capacity communities face increasing risks from flooding and wildfires.
You can customize these interactive maps in three ways:
- Select a state.
- Use the Rural Capacity dropdown menu. Choose to view either the lowest quarter OR lowest half of communities ranked by the Rural Capacity Index.
- Move the Risk slider bars below the maps. Move sliders to the right to see communities with higher risk of flooding and wildfires.
Supporting communities
To achieve the infrastructure and climate adaptation goals in federal programs, funding agencies must consider community capacity. Programs may need to be structured differently and new strategies may need to be created to support under-served and historically disinvested communities.
Using the Index, community capacity can be supported in many ways:
- Provide direct funding. For communities with low Index scores, eliminate the need for competitive grants, which many lower-capacity communities lack the resources and expertise to apply for and administer. Federal and state programs can identify where the needs are greatest and allocate funding accordingly.
- Improve access to competitive grants.
- Allow funding to be used to build capacity—not just used for projects. For example, funding could be used for new staff positions and technical training to support long-term investments.
- Eliminate or reduce match requirements. City and county budgets in low-capacity communities may not have the revenue to meet matching requirements.
- Revise requirements for benefit-cost analyses. These technical reports are expensive and highly technical. They often undervalue the benefits of projects in lower-capacity and lower-income communities.
- Fund technical assistance. Administered by state or federal agencies or by nonprofit partners, technical assistance programs provide expertise in project identification, design, and implementation, as well as assistance in compiling grant proposals.
- Increase funding for multi-jurisdictional projects. Funding regional projects that leverage urban-rural partnerships can benefit low-capacity communities. This may require investment in regional institutions and organizations that can help coordinate resources and prioritize projects.
- Address root problems. Low-capacity communities are often economically dependent on farming and other natural resource sectors associated with volatile revenue. By strengthening policies that encourage economic diversification, state and federal policymakers can help communities generate predictable local revenue needed for infrastructure and adaptation.
Limitations of a capacity index
While indices can be useful for identifying broad trends and patterns, they have limitations. Indices inherently combine variables, potentially obscuring the primary reasons such trends exist. To help reduce this noise, raw data is provided in the interactive map for each of the 12 variables that power the Rural Capacity Index.
Since variables for the Rural Capacity Index are based on data at the county and community scales, the Index will not account for regional- or state-level support that may be available. For example, in some parts of the country, multi-county watershed groups or state-level technical advisory organizations bolster community capacity.
This Index prioritizes rural capacity needs over metropolitan needs because metropolitan regions intrinsically have more capacity: more workers and resources. Additionally, rural places are often overlooked in the allocation of federal funding. However, this does not negate the fact that some metropolitan regions also have needs for increased capacity, which is not emphasized by this Index.
Most significantly, this Index relies on an imperfect, short snapshot of variables that can be quantified, but many components of community capacity are not easily measured. The resilience of people, the power of community cohesion, the depth and breadth of informal networks, and a community’s story are difficult to capture in a number. Capacity is also a dynamic state and can change.
Despite these limitations, the Rural Capacity Index can help identify places where more focus is needed and deeper research can be pursued. Headwaters Economics is continually refining the Rural Capacity Map. If you would like to provide feedback or have suggestions for improvement, please contact us.

Data Sources and Methods
Overview
The Rural Capacity Index is based on 12 indicators grouped into four weighted categories: local government staff and expertise; institutional capacity; economic opportunity; and education and engagement. Indicators are nationally available and were identified and weighted through literature review and expert opinion. The Index score is displayed as the national percentile rank. We define "low" capacity as a national percentile of <33%, "medium" capacity as 33-66%, and "high" capacity as >66%. The Index is continually updated and improved (see Release Notes for details).
Indicators
The Rural Capacity Index is based on 12 indicators in four categories.
Local Government Staff and Expertise
- Metropolitan. Counties classified as “non-core” were given a score of 0. For our purposes, “non-core” counties were those that were not classified as Metropolitan-Central, Metropolitan-Outlying, or Micropolitan-Central. All other counties were given a score of 100. County subdivisions and communities were assigned the value of their parent counties. The metropolitan indicator was not used to assess the capacity of tribal areas. Source: U.S. Census Bureau, 2020. Population Division, Office of Management and Budget Delineation Files, March 2020.
- Head of planning. Places with at least one head of planning/zoning were given a score of 100. The mailing addresses listed for each planner were compiled from a phone-verified directory of 14,568 municipalities, townships, and counties (every government is contacted every 3 months), and then geocoded. Source: Power Almanac, April 2023.
- Gaining/Losing government jobs. Change in the number of state and local government employees per 1,000 residents from 2010 to 2022. County subdivisions and communities were assigned the value of their parent counties. Source: Bureau of Economic Analysis, Regional Data Tables, 2022.
Institutional Capacity
- Has college or university. The presence of at least one college or university that offers post-secondary awards (e.g., associate’s degree) or higher received a score of 100. These data include every accredited college, university, and technical and vocational institution. We removed cosmetology schools and removed satellite and branch campuses run through primary and secondary institutions (K-12) or correctional facilities. Source: U.S. Department of Education, 2023: Database of Accredited Postsecondary Institutions and Programs.
- Isolation. The drive time in minutes to the nearest city with a population > 50,000. Drive time is calculated using an OD Cost Matrix (Origin-Destination). We used ACS 2022 data to identify Census Designated Places (CDPs) with a population greater than 50,000. To calculate the drive time for non-CDPs (counties, county subdivisions, and Tribal Areas), we identified all CDPs intersecting each non-CDP and calculated the median drive time. For those non-CDPs without an intersecting CDP, we identified the populated areas within each non-CDP. If the non-CDP was less than 140,000,000 sq meters, we calculated the drive time from the closest center point within the populated area. For those non-CDPs with an area greater than 14,0000,000 sq meters we calculated the median drive time from four random points within the populated areas of that non-CDP. Source: U.S. Census Bureau, American Community Survey, 2022. U.S. Census Bureau, TIGER files, 2022
Economic Opportunity
- Population change. Change in population from 2010 to 2023 as a fraction of the 2023 population of the county/county-subdivision/community/tribal area. Source: U.S. Census Bureau, National Historical Geographic Information System, 2023.
- Income stability score. Standard deviation (inverted) in annual per capita income from 2000 to 2022, adjusted for inflation. A low score indicates higher volatility in income and can be indicative of more volatile tax revenues. County subdivisions and communities are assigned the value of their parent counties. Tribal areas are assigned a value based on area weighting for all intersecting counties. Source: Bureau of Economic Analysis, Regional Data Tables, 2022.
- Families above poverty level. Number of families not in poverty as a percentage of the total number of families in the county/county-subdivision/community/tribal area. Source: U.S. Census Bureau, American Community Survey, 2023.
- Households with broadband. Number of households with a broadband subscription of any type as a percentage of the total number of households in the county/county subdivision/community/tribal area. Source: U.S. Census Bureau, American Community Survey, 2023.
Education and Engagement
- Voter turnout. Percent of voting-age citizens (lower 48 and Hawaii) and registered voters (Alaska) who voted in the 2020 presidential election. County subdivisions and communities are assigned the value of their parent counties. Tribal areas are assigned a value based on area weighting for all intersecting counties. Due to missing data, we used different data sources to calculate voter turnout for Alaska. Sources for lower 48 and Hawaii: MIT Election Data and Science Lab, 2018, County Presidential Election Returns 2000-2020, Harvard Dataverse, V11; and U.S. Census Bureau, American Community Survey, 2020. Citizen Voting Age Population (CVAP) Special Tabulation from the 2016-2020 5-Year American Community Survey. Sources for Alaska: Voting and Election Science Team, 2020, 2020 Precinct-Level Election Results, Harvard Dataverse, V40; and Alaska Division of Elections, General Election – November 2020, Results by Precincts.
- Adults with higher education. Percent of individuals 25 years or older with a bachelor’s degree or higher, as a percentage of the total number of individuals 25 years or older in the county/county-subdivision/community/tribal area. Source: U.S. Census Bureau, American Community Survey, 2023.
- People with health insurance. The insured population as a percentage of the total population of the county/county-subdivision/community/tribal area. Source: U.S. Census Bureau, American Community Survey, 2023.
Calculating the Index
To calculate the Index, data for each indicator were normalized to values between 0 and 1. Any data missing at a given location was replaced with the national median value. The mean of the indicators within each of the four categories was then weighted by the following multipliers:
- Local Government Staff and Expertise: 1.12
- Institutional Capacity: 1.04
- Economic Opportunity: 1.03
- Education and Engagement: 1.0
To determine each category’s weight, we surveyed 250 individuals from local or state government staff (75% of respondents), the private sector (25% of respondents), and nonprofit organizations and federal agencies (25% of respondents). The relative weight for each category of the Rural Capacity Index was calculated as the mean survey score for each category divided by the mean score for the lowest-ranked category.
We then took the mean score of the four weighted categories, resulting in a total Index score. The Index is then normalized to a value between 0 and 1.
Geographic Boundaries
Geographic boundaries included in the Rural Capacity Map include counties, county subdivisions, communities, and Tribal Areas.
- County subdivisions include legally recognized minor civil divisions (MCDs), such as townships. For states without MCDs, the Census draws its own subdivisions (these are statistical entities with no local legal recognition).
- Communities are areas of concentrated population represented in the Census' Places TIGER/Line files and include both incorporated and unincorporated communities.
- Tribal Areas are derived from the U.S. Census Bureau's American Indian/Alaska Native/Native Hawaiian Areas (AIANNH), which includes the following legal entities: federally recognized American Indian reservations and off-reservation trust land areas, state-recognized American Indian reservations, and Hawaiian home lands (HHLs).
To normalize and rank Index scores, counties are ranked against counties, Tribal Areas are ranked against Tribal Areas and counties, county subdivisions are ranked against county subdivisions, and communities are ranked against communities.
Sources: U.S. Census Bureau, TIGER/Line boundaries, 2023.
Flood Data
Flood data represent the percent of homes within each community that have a 1% annual chance of flooding. Source: First Street Foundation’s Flood Factor, 2023.
Wildfire Data
Wildfire data represent the risk to homes ranked against other U.S. communities. Source: U.S. Forest Service, Wildfire Risk to Communities, 2024.
Release Notes
The Rural Capacity Index was first released in 2022 and is continually updated. It is also available as an ArcGIS Feature Layer Web Map. Significant updates are described below.
February 2025
The Rural Capacity Index was updated in February 2025 to incorporate data updates for geographic boundaries, wildfire risk, and the following indicators: isolation, population change, families above poverty level, households with broadband, adults with higher education, and people with health insurance.
March 2024
The Rural Capacity Index was updated in March 2024 to include two additional indicators: isolation and gaining/losing government jobs. Other variables were updated to use the most recent data available. The methodology for calculating the index was updated to add weight based on four categories of capacity. Additionally, locations with missing data were assigned the national median.
June 2023
The Rural Capacity Index was updated in June 2023 to use more recent and complete data sources and to add tribal areas. Seven of the 10 indicators were updated to a more recent vintage of the original data source. Data sources for three indicators were changed. These were: metropolitan; has college or university; and voter turnout. In this version, instead of excluding communities that were missing data, we normalized the Index to the number of variables for which data exist.
February 2022
The first version of the Rural Capacity Index was released in February 2022. It was based on 10 indicators: metropolitan; head of planning; has college or university; adults with higher education; families above poverty level; households with broadband; people with health insurance; voter turnout; income stability score; population change. Communities missing data for any of the 10 indicators were excluded from the Index.
Acknowledgments
Updates and improvements to the Rural Capacity Map were supported, in part, by the Climate Program Office of the National Oceanic and Atmospheric Administration (NOAA).
The team at Element 84 contributed knowledge and technical expertise to this project. Element 84 is a professional services firm that develops geospatial data processing pipelines and builds software that helps answer big questions about our health, our infrastructure, and our changing planet.