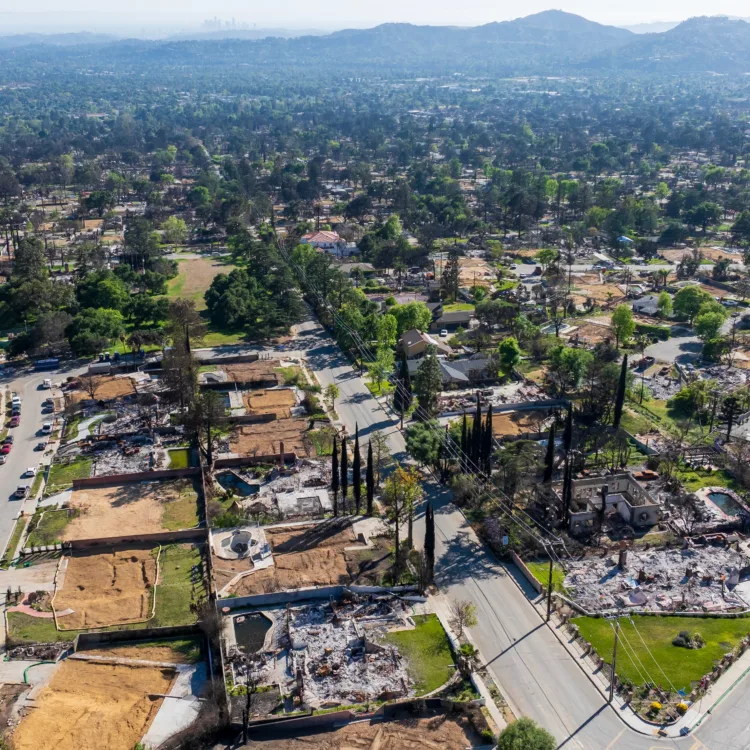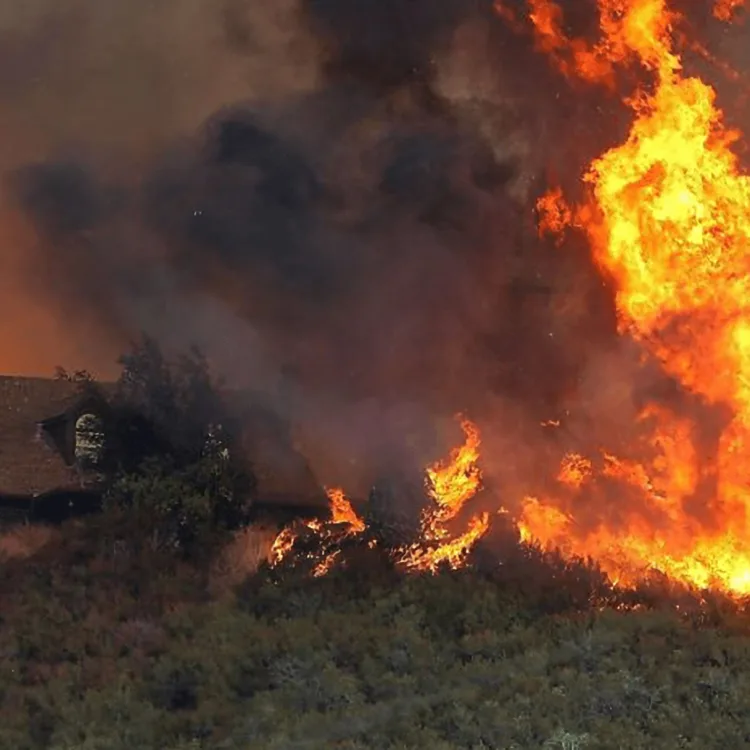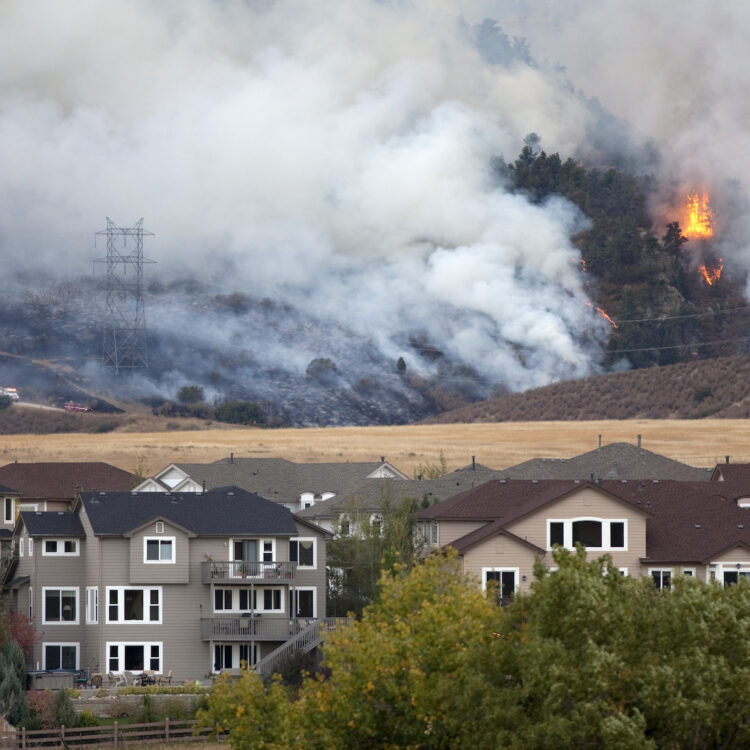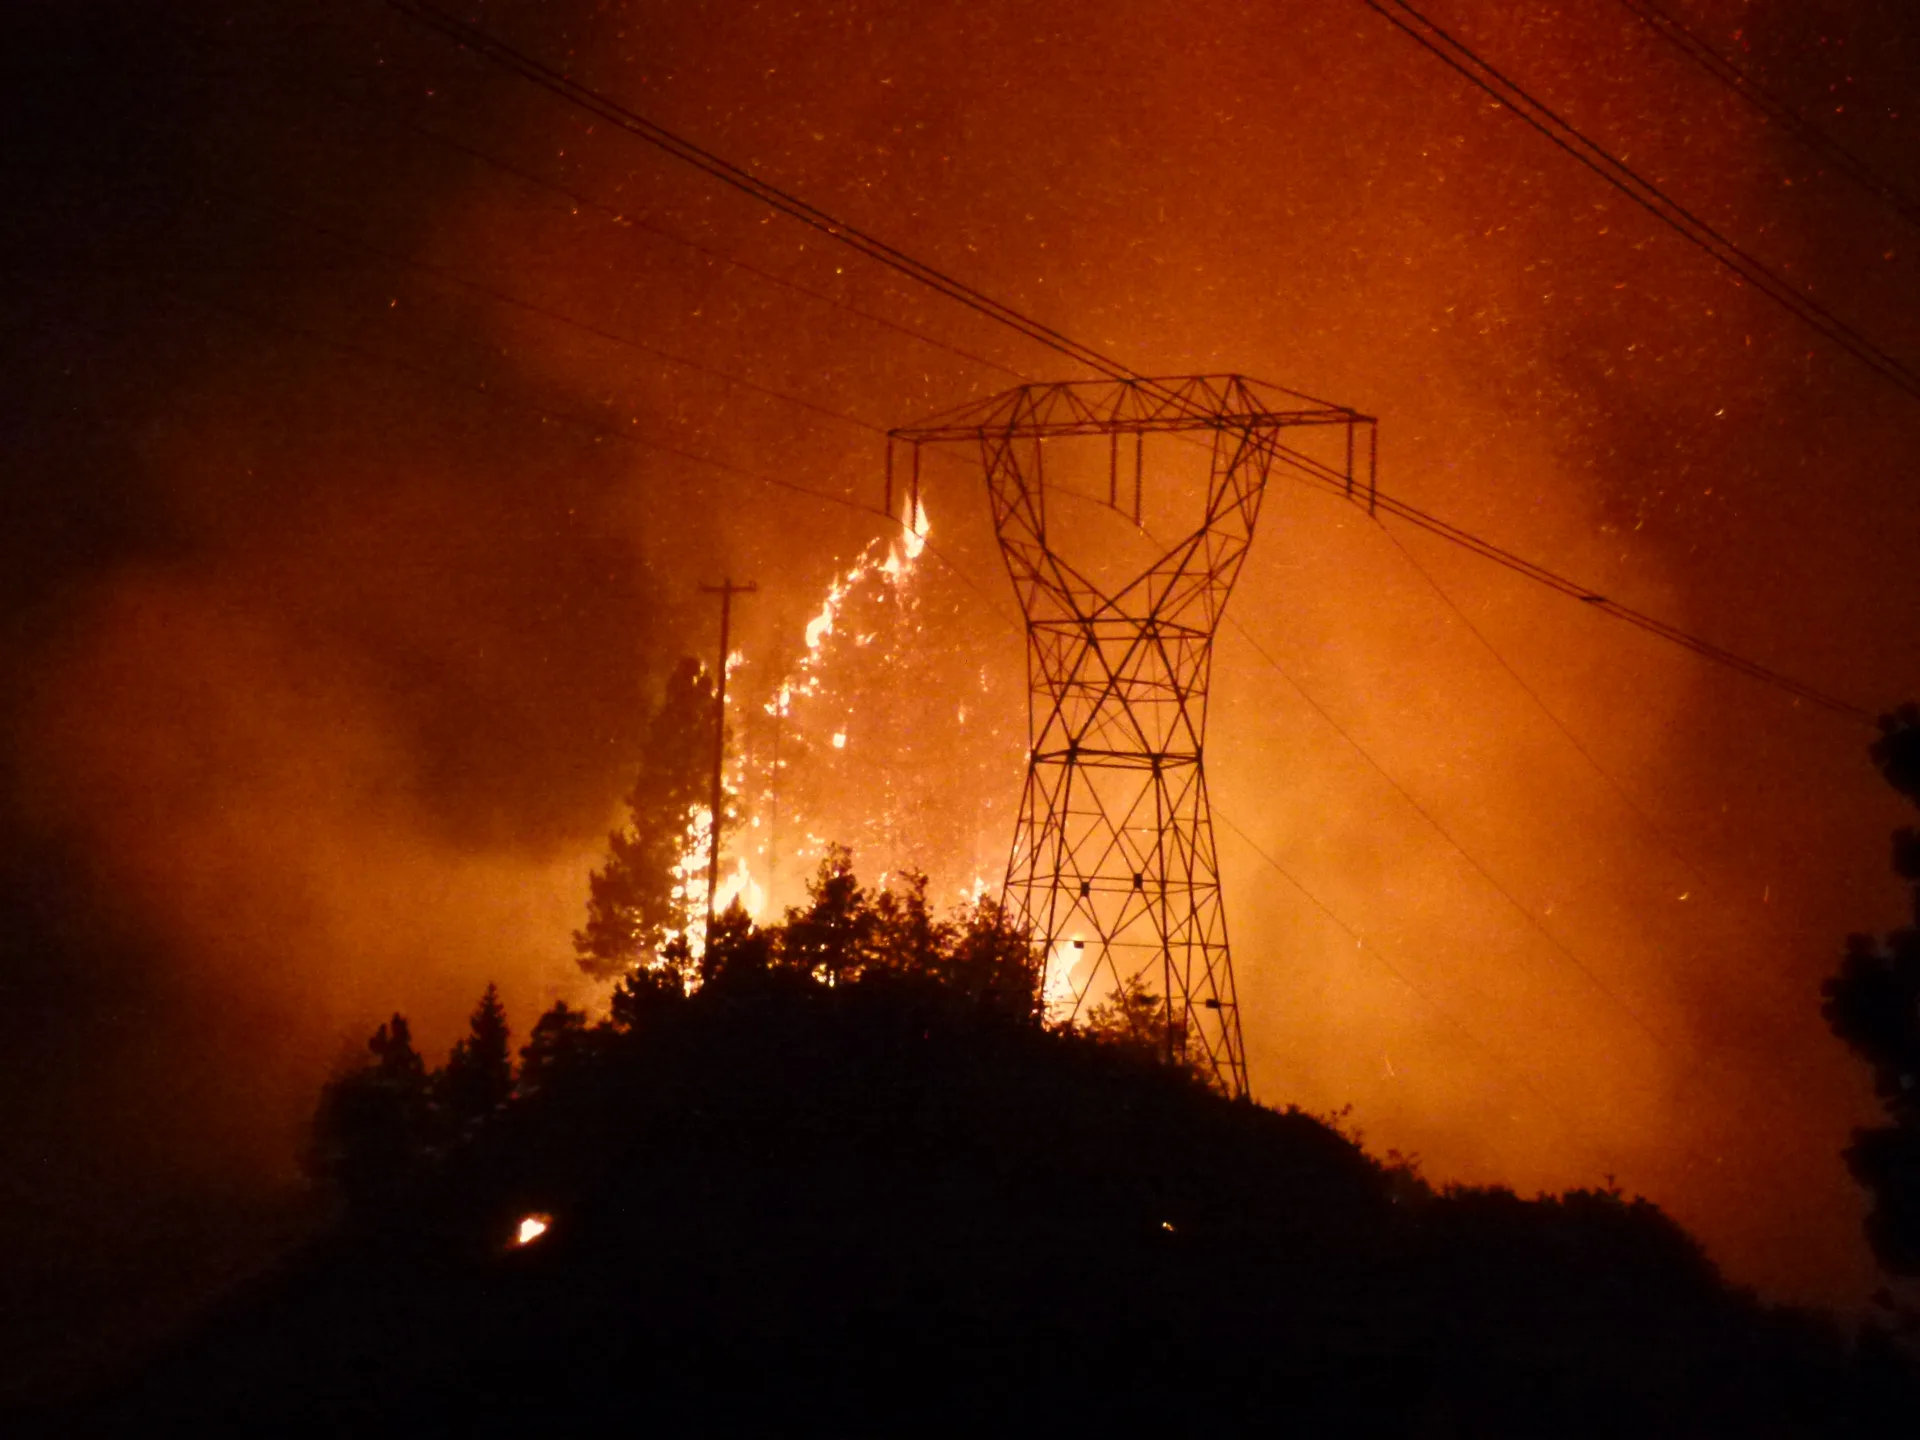
More than three quarters of all wildfires in the United States are caused by humans. Open burning that gets out of control, vehicles sparking on dry grass, abandoned campfires, arson, and a host of other human activities ignite fires that burn millions of acres every year. In many respects, this is a discouraging statistic, yet it also presents a unique opportunity. Unlike lightning or other natural wildfire causes, human behavior can be adjusted. When we dive into the data we start to see several points of leverage that can help reduce the damage and disruption that come from wildfire disasters.
The job of preventing wildfires usually falls to local fire managers, fire departments, or emergency managers. These professionals are always looking for more effective ways to communicate with the public about seasonal fire dangers or other trends, the same goal Smokey Bear has championed for 80 years. Clear, comprehensive data about local fire risk and specific causes of wildfire can help these leaders improve preventative measures and reduce impacts of wildfires on communities.
Want research like this in your inbox?
Subscribe to our newsletter!
To help provide wildfire managers with the resources they need, Headwaters Economics has developed a free tool based on data collected by the U.S. Forest Service that reveals useful trends about human-caused wildfire ignitions in any U.S. community.
For every county in the United States, this tool shows the causes and seasonality of human-ignited wildfires between 1992 and 2024. You can use filters to view national, state, or county-level data and change the year range to view specific timeframes.
From 1992 to 2024 these data show that 77 percent of wildfires have been ignited by humans. If the you exclude the number of “unknown” ignitions in the data, that figure jumps to 85 percent.
Inconsistencies in how states track wildfire data can blur some local trends, but these data are the most comprehensive, reliable source for understanding when, where, and how wildfires start. For more information, see Data Sources and Methods below.
This visualization is also available at Wildfire Risk to Communities, a website created by the Forest Service to help communities understand, explore, and reduce wildfire risk.

Using data to prevent ignitions
The data displayed in this tool identify several trends that can help fine-tune regional wildfire prevention efforts. For example, seasonal trends can be used to identify the best timing for public service announcements that target common types of ignitions. A summer spike attributed to campfires can help local managers decide when to deploy signage or camping restrictions.
Using data to prevent human-caused ignitions is just one important part of a smarter, more proactive approach to wildfire that is gaining traction in the research and firefighting community. Even the best prevention efforts cannot stop every wildfire: drought and wind can turn any ignition into a fast-moving disaster. That reality means communities also need to invest in protecting homes and neighborhoods before a fire arrives through steps like building defensible space, installing ember-resistant roofing, and adopting fire-adapted building codes. This comprehensive approach — preventing the ignitions we can while hardening communities against the ones we can’t — will be the best defense against rising wildfire risk, more costly insurance, and expensive disaster recovery.
Where more wildfire prevention is needed, and where we are succeeding
A close look at the different categories of human-caused wildfire shows areas requiring more prevention activity, as well as a few success stories of humans adjusting their behavior to prevent wildfires. The data summaries below compare two 10-year periods: 1992–2001, the earliest for which ignition data are available, and 2015–2024, the most recent.
A spike in the number of wildfires caused by open burning in Texas and Colorado
| 1992-2001 | 2015-2024 | |
|---|---|---|
| Texas | 6,979 | 22,593 |
| Colorado | 468 | 2,742 |
Debris and open burning is by far the top category of human-caused wildfires. Since 1992, more than 611,000 fires were caused by debris and open burning, with the resulting wildfires burning an estimated 8.6 million acres. Debris and open burning has been a leading cause of human-ignited wildfires for years with no clear downward trend and is even increasing in some places. In Texas, the number of wildfires triggered by debris and open burning more than tripled between the first decade that data is available (1992-2001) and the most recent (2015-2024). In Colorado, they have increased more than fivefold in the same timeframe.
Equipment and vehicles cause wildfires with lower frequency, but the impact is high. From 1992 to 2024, more than 216,000 fires from equipment and vehicles burned 10.9 million acres. There has been a slight upward trend nationally, with Texas leading. California and Florida have seen decreasing trends in wildfires caused by equipment and vehicle use.
Wildfire ignitions attributed to power lines are rising sharply. In the early 1990s, these ignitions registered at about 200 per year, but that figure has recently grown to 2,500—a 13-fold increase. Wildfires attributed to power lines burn an average of 125 acres per fire, the largest of any human cause.
There are some interesting state-level trends regarding power line ignitions. Texas and North Carolina are responsible for most of the national surge. Texas went from 67 power line ignitions (1992-2001) to 4,474 (2015-2024). North Carolina went from 32 power line ignitions (1992-2001) to 2,903 (2015-2024).
California and Oregon are often associated with a high risk of wildfires caused by power lines, but both have seen their power line ignitions plateau or even decline recently. This is likely due to grid hardening and Public Safety Power Shutoffs (PSPS) programs. Oregon was an early leader in utility fire risk management and passed some of the first state-level vegetation management requirements for power lines — the data suggest those efforts worked. Wildfires attributed to power lines in Oregon dropped by 75% from the first decade of the available data to the most recent.
Wildfire caused by arson is declining nationally. Arson peaked from the late 1990s to 2006 with about 14,000 to 20,000 recorded fires per year. This figure has dropped dramatically to around 4,300 to 5,300 per year recently.
The nationwide decline in smoking appears to be showing up in wildfire data. Nationally, fires attributed to smoking peaked at around 3,500 per year from 1999 to 2001, declined gradually through the 2000s, and then fell sharply after 2018, with only 822 such fires recorded in 2019. Since then, the annual rate has stayed below 1,100. This decline almost certainly reflects declining smoking rates as well as widespread no-smoking rules on public lands.
Tools like this—and the free and openly provided data they depend on—are essential to how communities prevent wildfires and reduce risks. Because people cause the vast majority of wildfires, knowing exactly where and when those ignitions cluster gives communities something to act on directly: targeting campfire and recreation restrictions in hot spots, prioritizing power line maintenance and roadside vegetation management along ignition-prone corridors, and factoring ignition patterns into land-use decisions about where new development and infrastructure go. Publicly available data can help guide a comprehensive approach that includes preventing ignitions, effective wildfire response, smart land use planning, fuel reduction, and new strategies for living in high-risk areas. All these approaches can help reduce wildfire risk, making us better prepared to live with wildfire while protecting neighborhoods and lives.
Data sources and methods
The data in this visualization are from the U.S. Forest Service’s Spatial Wildfire Occurrence Data, also known as the fire-occurrence database (FOD), a national record of wildfires from 1992 through 2024 (Short KC. (2026). Spatial wildfire occurrence data for the United States, 1992–2024 [FPA_FOD_20260615] (7th ed.). Fort Collins, CO: Forest Service Research Data Archive. https://doi.org/10.2737/RDS-2013-0009.7).
The FOD acquires wildfire records from the reporting systems of federal, state, and local fire organizations, including information about the date, location, size, and cause of fires. Each wildfire is assigned a point, which may or may not be the precise location of the ignition. We assigned each georeferenced individual fire point to a county to create the visualization above.
Trends of ignition causes over time may reflect shfts in behavior, but may also reflect changes in cause classification and reporting practices over time.
Editors note August 4, 2026: The opening paragraph of this post was modified to state that more than three quarters of all wildfires in the United States are caused by humans, not 85 percent. This better reflects the data set used for our visualization. Excluding “unknown” ignitions from the total number of recorded ignitions yields an 85 percent rate of human-caused wildfires.