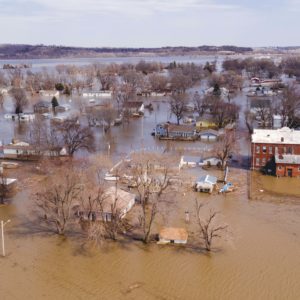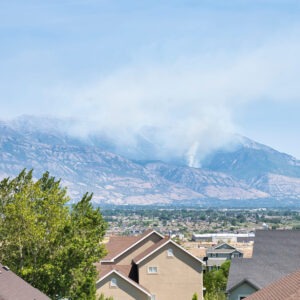
Local governments are the first line of defense when emergencies and disasters occur. They are also largely responsible for planning, funding, constructing, and maintaining projects to decrease risks before disasters happen—but many lack the resources to do so. While the federal government has recently developed maps to identify disadvantaged, at-risk, and in-need communities, it has failed to account for local government capacity—including staffing and expertise. As a result, many federal grants and programs are failing to build climate resilience in low-capacity parts of the country, compounding legacies of disinvestment.
Federal maps are guiding billions in climate investments
In recent years, federal agencies have produced maps intended to identify communities that are overburdened, underserved, at-risk, and in-need. The maps are being used to help allocate billions of dollars across hundreds of programs for climate resilience, housing, energy, and infrastructure. For example, communities identified by these maps may qualify for extra points in grant applications, be eligible for matching fund waivers, or be prioritized for technical assistance.
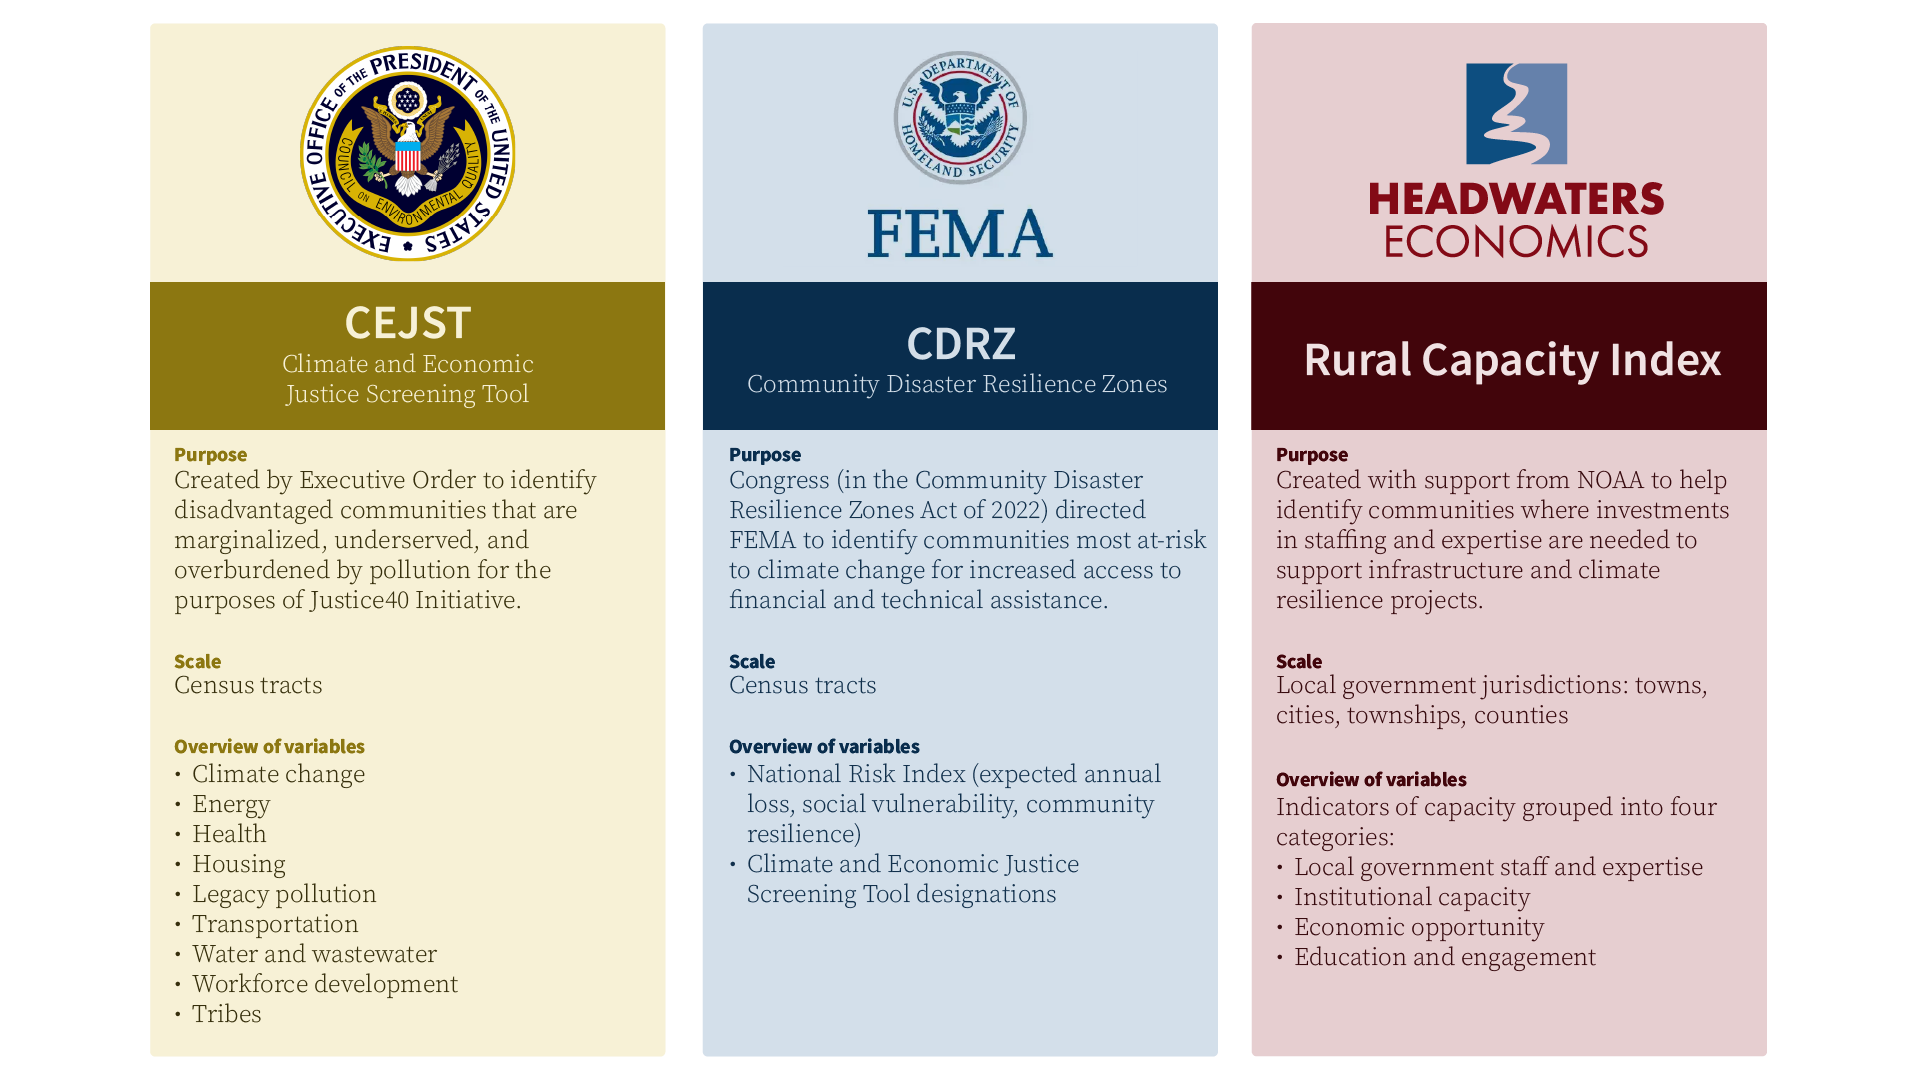
Two of these maps are particularly focused on identifying places that will benefit most from investments in climate resilience:
- The Council on Environmental Quality’s Climate and Economic Justice Screening Tool (CEJST)
- FEMA’s Community Disaster Resilience Zones (CDRZ)
Both maps were designed to provide a geographic focus for strengthening community resilience and reducing impacts from climate change. Both maps exemplify how federal agencies are making important progress to identify needs and prioritize resources. For instance, urban neighborhoods with high levels of poverty and exposure to hazardous pollution are effectively identified, and research has shown that CDRZ has identified needs in counties with higher levels of racial diversity.
However, neither CEJST nor CDRZ incorporates factors that represent local government capacity barriers. This constitutes a gap in the identification of “in-need” communities since capacity-limited local governments frequently need support to plan projects and fulfill complicated application and reporting requirements necessary to access federal funding programs. Since CEJST and CDRZ are currently influencing the allocation of billions of dollars of federal funding, the fate of low-capacity places becomes an important question.
In a new analysis, Headwaters Economics and the Bill Anderson Fund analyzed how local capacity aligns with the CEJST and CDRZ federal climate vulnerability maps. We compared the CEJST and CDRZ maps to Headwaters Economics’ Rural Capacity Index, which defines “capacity” as a community’s ability to plan, fund, implement, and maintain infrastructure and municipal projects such as climate adaptation. Read more under Data Sources and Methods below.
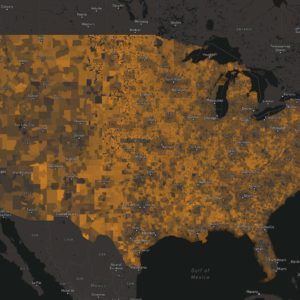
Headwaters Economics’ Rural Capacity Index
The Rural Capacity Index is available online and is free to download. The index is based on 12 indicators grouped into four weighted categories: local government staff and expertise; institutional capacity; economic opportunity; and education and engagement. Indicators are nationally available and were identified and weighted through literature review and expert opinion. The Index score is displayed as the national percentile rank. We define “low” capacity as a national percentile of <33%, “medium” capacity as 33-66%, and “high” capacity as >66%. The Index is continually updated and improved.
Our analysis compares three climate vulnerability maps.
A smaller share of low-capacity communities are identified for support
The analysis shows that only 4% of low-capacity communities are identified by CJEST, compared to 27% of high-capacity communities. In other words, a high-capacity community is seven times more likely to be identified by CEJST for federal support.
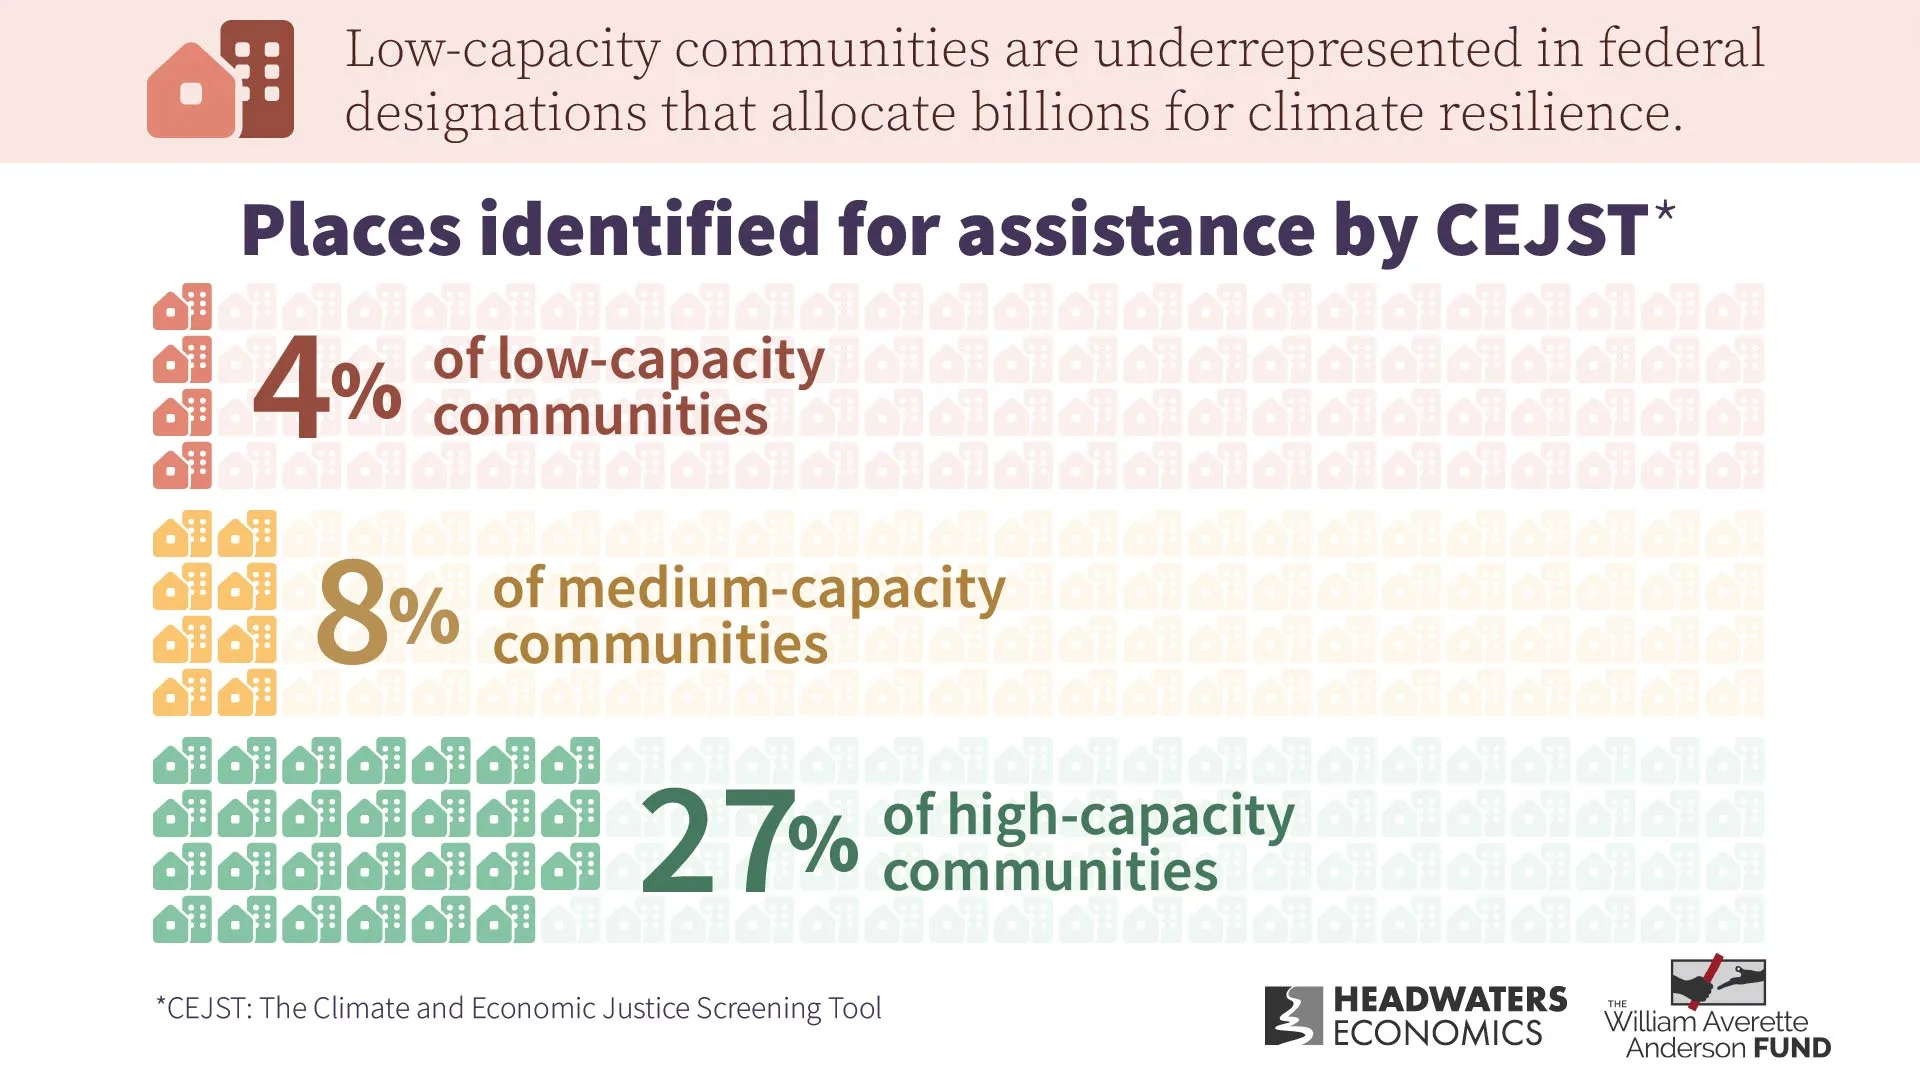
When all U.S. communities (31,151 in total) are ranked by capacity, only 4% (421) of low-capacity communities, the lowest-ranked third, have one or more CEJST-designated tracts within their jurisdiction. By comparison, 8% (834) of medium-capacity communities have CEJST-designated tracts, and 27% (2,805) of high-capacity communities have CEJST-designated tracts.
The CDRZ map identifies a subset (approximately 2%) of CEJST tracts, and similarly predominantly identifies higher-capacity places as at-risk and in-need. Only 0.1% (11) of low-capacity communities have one or more CDRZ-designated tracts within their jurisdiction. By comparison, 0.1% (14) of medium-capacity communities have CDRZ-designated tracts, and 1.5% (157) of high-capacity communities have CDRZ -designated tracts.
Since many CDRZ tracts fall outside of incorporated towns and municipalities, we also compare the alignment with low-, medium-, and high-capacity counties. Only 5% (50) of low-capacity counties have one or more CDRZ-designated tracts within their boundary. By comparison, 8% (88) of medium-capacity counties have CDRZ -designated tracts, and 13% (132) of high-capacity counties have CDRZ -designated tracts.
Regionally, there are also disparities between capacity needs and areas identified as vulnerable by the CEJST and CDRZ maps. The Midwest and Interior West rank lowest in capacity. However, these two regions have the lowest percentage of CEJST- and CDRZ-designated tracts. Only 6% (1,888) of all 29,688 CEJST tracts are in the Interior West and just 9% (2,683) are in the Midwest, compared to 15% (4,597) in the Northeast. See a list of states by region in Data Sources and Methods below.
As a result of capacity barriers faced by communities in the Midwest and Interior West, they may continue to miss out on federal grants. For example, according to data from USASpending.gov, from 2000 to 2023, $18 billion (only 18%) of competitive federal grants were awarded to communities in the Midwest and Interior West compared to $87 billion (82%) secured by communities in higher-capacity regions.
Capacity considerations are critical for determining need and allocating federal resources
Capacity is an important dimension of need that has not yet been incorporated into federal vulnerability maps.
Unless measures of capacity are explicitly incorporated, the CEJST and CDRZ maps may encourage awarding resources to communities that already have the capabilities to compete for and successfully secure federal funding. In other words, as currently designed, these maps risk reinforcing existing pathways toward either climate resilience or hardship.
With the addition of local capacity data these maps could help inform more strategic prioritization of grants and infrastructure investments, including transportation, energy, and climate resilience projects. Capacity data can be incorporated to identify where funding programs should be modified to ensure lower-capacity communities can access them, such as by waiving local match requirements and providing technical assistance.
CJEST and CDRZ represent important progress in measuring at-risk and in-need communities for the purposes of building resilient communities. To fully realize climate resilience goals, local capacity must be considered so that a more diverse set of places can safely weather future climate-related events.
Data Sources and Methods
This research compares three national climate vulnerability maps, analyzing their similarities and differences:
- Council on Environmental Quality’s Climate and Economic Justice Screening Tool (CEJST)
- FEMA’s Community Disaster Resilience Zones (CDRZ)
- Headwaters Economics’ Rural Capacity Index
Both the CEJST and CDRZ maps summarize data at the Census Tract level. Census relationship files were used to reconcile vintage differences in Census Tracts in order to enable comparisons across the CEJST and CDRZ maps. Vulnerability in both the CEJST and CDRZ maps is indicated as a binary result (yes/no).
The Rural Capacity Index summarizes data at the scale of local government jurisdictions: counties, townships, and Census Designated Places—otherwise referred to as communities. Capacity of a community is measured in terms of the national percentile rank where “low capacity” is defined as a national percentile of <33%, “medium capacity” as 33-66%, and “high capacity” as >66%.
To assess how local capacity aligns with the CEJST and CDRZ maps, we analyzed the capacity category (low, medium, or high) and the presence of CEJST- or CDRZ-designated tracts per jurisdiction. The spatial joins and calculations were conducted by two analysts using different platforms (ArcGIS and R) in a standard projection (North America Albers Equal Area Conic), to ensure accurate results. The analysis was conducted for all counties and communities in the United States.
Results were compared across the following regions:
Great Lakes: IL, IN, MI, MN, OH, WI
Gulf Coast: AL, FL, LA, MS, TX
Interior West: AZ, CO, ID, MT, NV, NM, UT, WY
Midwest: AR, IA, KS, MO, NE, ND, OK, SD
Northeast: CT, DE, DC, ME, MD, MA, NH, NJ, NY, PA, RI, VT
Pacific Coast: AK, CA, HI, OR, WA
Southeast: GA, KY, NC, SC, TN, VA, WV
Acknowledgments
The Bill Anderson Fund is a nonprofit organization whose mission is to expand the number of underrepresented minority professionals in hazards and disaster research, policy, and practice. Its programs provide professional development training, mentorship and fellowship to doctoral students committed to mitigating disasters and conducting research in partnership with minority communities.
Tiffany Cousins and Joseph Karanja, both Bill Anderson Fund Fellows, contributed technical and research expertise.

Tiffany “Tiff” Cousins is a GIS researcher. She is a doctoral student at Virginia Tech in the Urban Affairs and Planning department. Broadly speaking, her research interests are in understanding the application of GIS in disaster resilience and risk management. Tiff’s current research is in using crowdsourced data to create local pluvial flood maps.

Joseph Karanja is a PhD candidate at Arizona State University whose research focuses on heat modeling designs, and how they impact our understanding of the drivers of heat vulnerability and associated health outcomes. Currently, Joseph’s research uses spatial analytics to understand the role of the geographical context and personal exposure attributes that influence heat vulnerability. Joseph’s research interests intersect with Geographic Information science, urban health geography, and vulnerability science.
This research and improvements to the Rural Capacity Map were supported, in part, by the Climate Program Office of the National Oceanic and Atmospheric Administration (NOAA).