Updated September 2025
Nearly 40% of the United States is public land, supported by taxpayers and managed by federal, state, or local governments. Public lands include vast expanses of national forest and wilderness, national parks and monuments, wildlife refuges, rangelands, state trust lands, state parks and recreation sites, and city and county parks. Public lands are managed in many ways to achieve different goals. Policies governing public land management have significant, long-term impacts on local communities.
The Protected Areas Database of the United States (PADUS)—managed by the U.S. Geological Survey—is America’s official inventory of protected areas. The map tool below, developed by Headwaters Economics, draws on PADUS data to provide detail for every county in the U.S. Hover over a county to see the land ownership breakdown. Detailed reports can be downloaded by clicking on a county.
Public land ownership by county
Public land ownership by state
Subscribe to our newsletter!
The future of public lands & local communities are connected
Public land management directly affects local communities. County fiscal policy, socioeconomic change, and quality of life are impacted by public land management decisions.
Public lands influence local economies
Public lands—from expansive protected federal areas to community parks and trails—can influence the socioeconomics of local communities in many ways and can be important economic assets. In addition to drawing tourists, public lands attract businesses, retirees, and workers who seek the recreational opportunities, scenery, and quality-of-life amenities that public lands generate.
For example, rural Western counties with more federal land perform better, on average, than their peers in population growth, employment, personal income, and per capita income. Counties with national parks or national monuments support above-average rates of job growth and are correlated with higher levels of per capita income.
Public lands influence local demographics
Significant demographic changes have occurred in places with more federal public land. Counties with public lands see positive net migration overall. They also tend to have more ethnic and racial diversity than counties without public lands, although racial minorities are not using public lands at the same rate as white Americans.
Retirees and older Americans, in particular, have been moving to places with protected public lands, bringing an increased share of non-labor income from investments and retirement funds. Working-age Americans also are increasing in areas with public lands, finding employment in health care, real estate, retail, and other sectors.
Public lands influence local fiscal policies
Counties with federal land are compensated by the federal government for the tax-exempt status of federal lands within their boundaries through the PILT (“Payments in Lieu of Taxes”) program and revenue-sharing payments such as Secure Rural Schools (SRS). Counties with significant shares of federal land may rely heavily on payments from the federal government, which can slow growth and increase economic risks presented by a transitioning rural economy.
To learn more about the economics of public land, read related research and find county-level data in customizable reports from the Economic Profile System.
Methods and Data Sources
This post was originally published in June 2019. It is updated periodically to reflect the latest available data. The most recent update was Setember 30, 2025.
Data on land ownership are from U.S. Geological Survey (USGS), Gap Analysis Project (GAP), 2024, Protected Areas Database of the United States (PAD-US), 4.1. The PADUS strives to be a complete inventory of public land and other protected areas, compiling “best available” data provided by managing agencies and organizations. Completeness of the data varies across management agencies and states. Local data (city- and county-level) are the least complete.
Data cannot be compared between versions of PADUS due to changes in data collection and ownership categories between versions. Headwaters Economics intersects the PADUS data with geographic boundaries produced by the U.S. Census Bureau to compute ownership breakdowns at different geographic levels (e.g., counties).
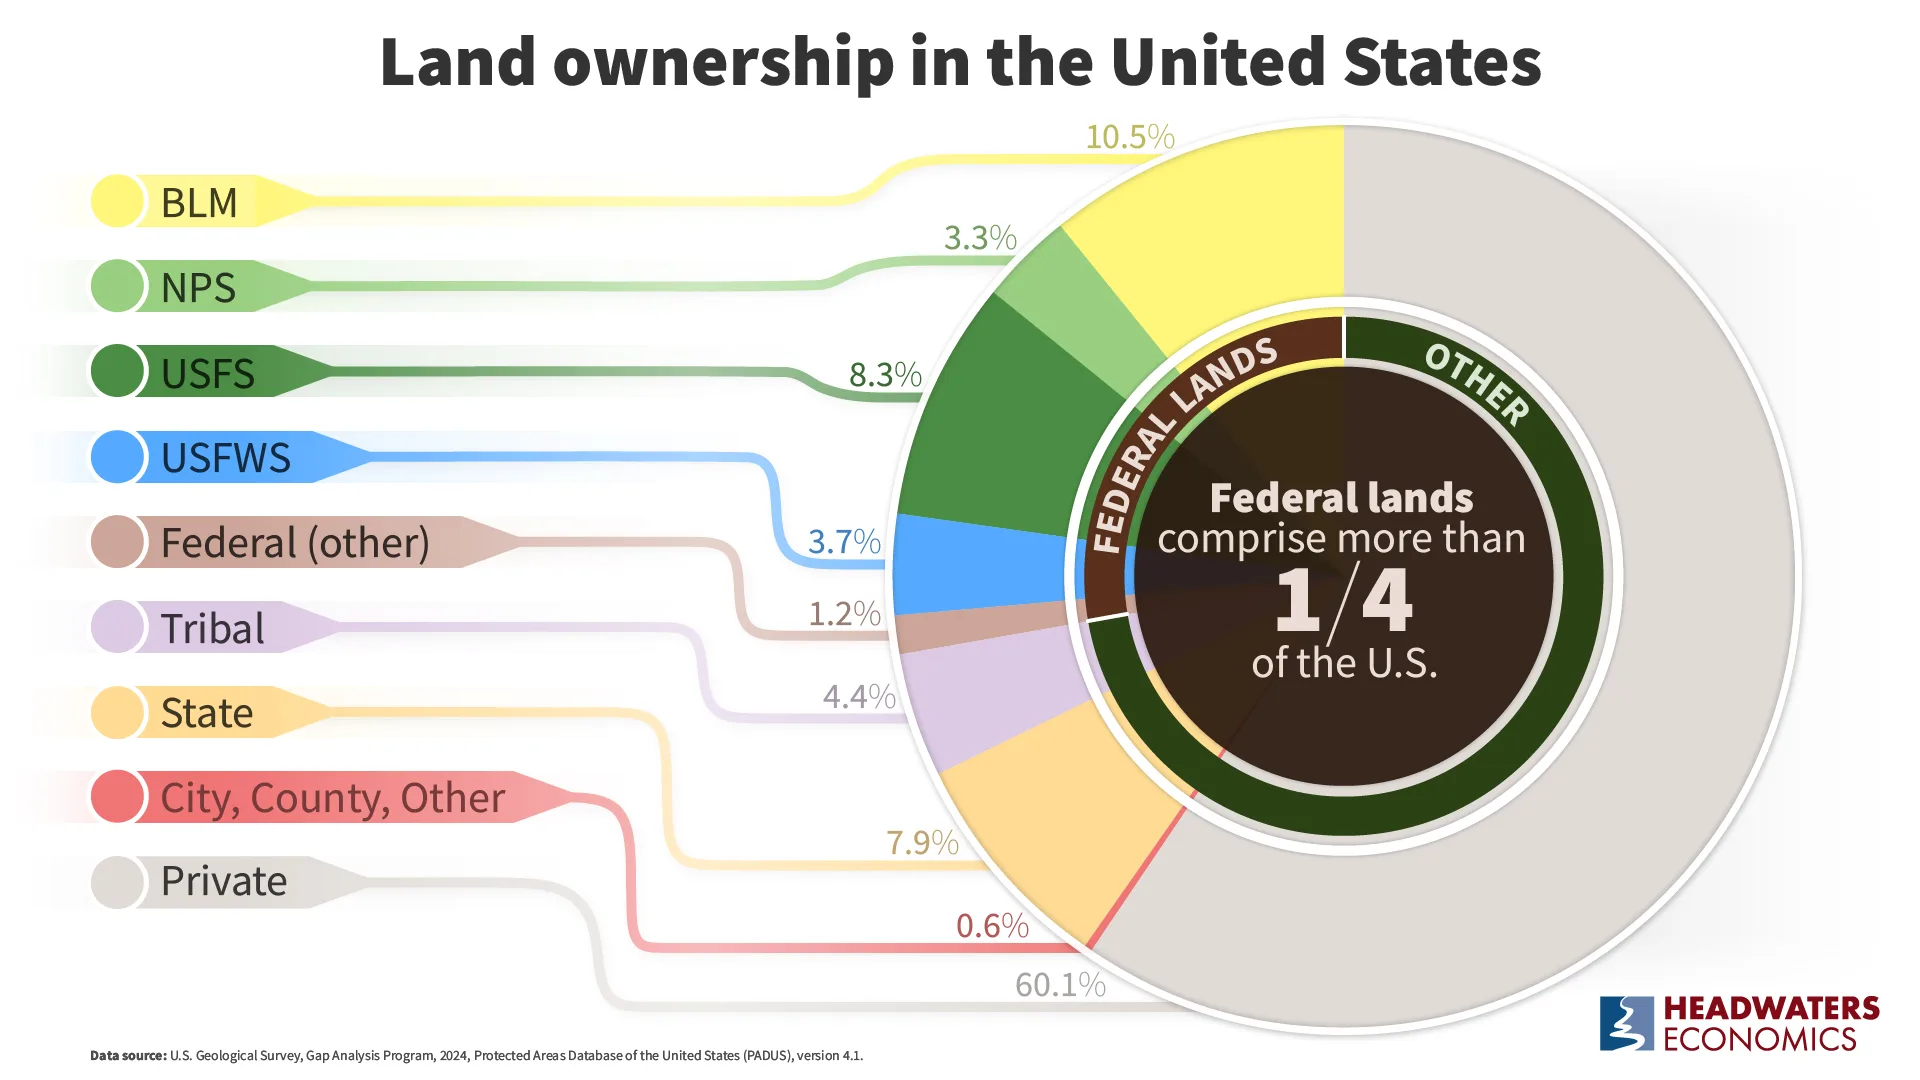
Ownership categories in the data visualization above include:
- BLM: Bureau of Land Management
- NPS: National Park Service
- USFS: United States Forest Service
- USFWS: United States Fish & Wildlife Service
- “Federal (other)” includes land owned by federal agencies not otherwise specified, such as Army Corps of Engineers, National Oceanic and Atmospheric Administration, Department of Defense, and Department of Energy.
- “City, County, Other” includes municipal and county-owned land, regional water management districts, and other locally-administered land.