Peter Nelson, PhD, is a Professor of Geography at Middlebury College in Vermont where he joined the faculty in 1999. He holds PhD and Master’s in Geography from the University of Washington and a BA in Geography from Dartmouth College. He teaches courses on population issues, the global economy and the rural United States. His current research funded by NSF focuses on migration to rural communities and rural gentrification. He has also examined subprime lending in rural housing markets (supported by USDA) and the connections between aging baby boomers and Latinos arriving in certain rural destinations.
Nelson’s recent articles include: “Rural gentrification and networks of capital accumulation—A case study of Jackson, Wyoming” in Environment and Planning A; “The global rural: gentrification and linked migration in the rural USA” in Progress in Human Geography; “Baby Boom Migration and Its Impact on Rural America” for the U.S. Department of Agriculture; “Linking baby boomer and Hispanic migration streams into rural America” in Population, Space and Place; and “Rural gentrification and linked migration in the United States” in Journal of Rural Studies.
Peter lives in Weybridge, Vermont (population 824) with his wife and two sons. He enjoys fly-fishing, biking, golf, and anything involving skis.
Public Lands, Amenities, and Demographic Dynamics
In 1954, Edward Ullman wrote, “[f]or the first time in the world’s history pleasant living conditions – amenities – instead of more narrowly defined economic advantages are becoming the sparks that generate significant population increase, particularly in the United States” (Ullman 1954, page 119). Ullman made his claim based on observations of regional population shifts in the 1930s and 1940s largely out of the North and East and toward destinations in the South and West with more pleasant climates, particularly California, Arizona, and Florida. Despite Ullman’s amenities hypothesis, the rusting of the “Rust Belt” and suburbanization dominated the lion’s share of the migration literature in the 1960s, 1970s, and 1980s. However, in the 1990s in the context of the “Rural Rebound,” migration scholars began to examine more explicitly the relationship between amenities and demographic change.
This new line of research broadened the scope of natural amenities beyond Ullman’s simple climatic focus to include such factors as recreational opportunities and access to public lands. The amenity-migration relationship was particularly evident in many Rocky Mountain communities undergoing an economic transition from heavy dependence on traditionally extractive industries to more service-based economies (Gosnell and Abrams 2010). These economic shifts coupled with previously unseen levels of population growth sparked considerable debate over the appropriate uses of public lands. Those with stronger connections to the “old” economy worried that certain management decisions may limit access to timber, minerals, or grazing traditionally available on public lands. At the same time, others argued that greater protection of unique environmental and cultural resources found on public lands could be seen as an economic development tactic as these place-based resources could draw in footloose individuals, households, and businesses (Power and Barrett 2001). These debates continue today as the Trump Administration, under influence from the coal, uranium, and natural gas industries, is working to scale back the size of some of the more recently created national monuments in places like Grand Staircase Escalante and Bears Ears in southern Utah.
While a sizeable literature exists examining amenities and demographic change from the 1990s, scholarly attention on the topic has waned to some extent more recently with the overall slowing of migration across the country (Cooke 2013). This essay employs a simple descriptive analysis of the demographic structure and change over the last 25 years in counties with public lands, paying particular attention to the various demographic components of change (natural increase vs. migration), age structure, and racial/ethnic diversity. The descriptive and exploratory analysis is designed to determine the degree to which counties with public lands present distinct demographic signatures compared to those counties without public lands. The results open up a series of remaining research questions surrounding the relationship between conserved public lands and the demographic dynamics in their adjacent communities.
Identifying Public Lands Counties
“Public lands” is a rather crude term and can encompass a variety of different spaces ranging from the playground at a local primary school to vast stretches of federally managed national forests and parks. In the analysis below, we identify public lands as those managed by the federal government, yet even these federal lands are quite diverse and include military reserves or BLM rangelands. To narrow our focus even further, we limit our analysis to four different types of federal lands: national parks, federally designated wilderness areas, national monuments, and national recreation areas. Map 1 and Figure 1 display the geographic distribution of these types of federal lands across the nine U.S. Census Divisions.
We consider any county with one or more of these four types of public lands within its borders as a “public lands” county. The remaining counties we label as not having any public lands. In the analysis below, we limit the set of counties to those in the lower 48 states and examine only nonmetropolitan counties.
Map 1: Relatively protected state and federal lands and lands subject to extraction.
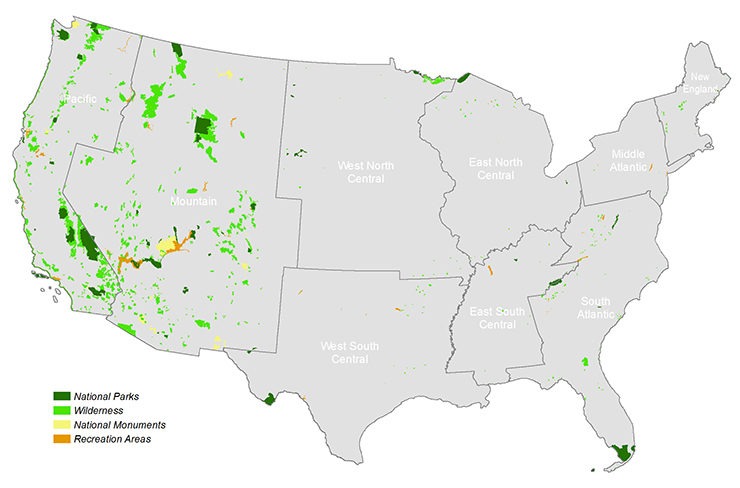
Figure 1: Proportion of federal lands by Census Divisions. Note: The total set of counties is limited to nonmetropolitan counties.
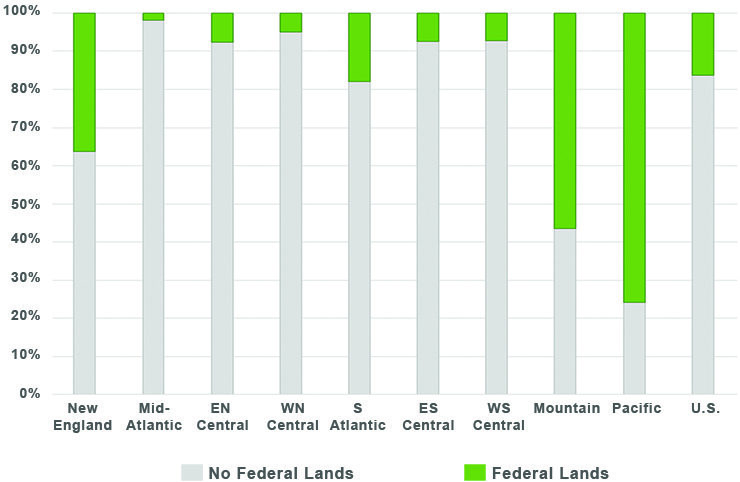
Overall, 316 (16%) of the nonmetropolitan counties in the lower 48 are public lands counties, yet it is clear from Map 1 and Figure 1 that federal lands are not distributed evenly across the United States. Public lands counties are quite uncommon in five of the nine Census Divisions: the mid-Atlantic, East North Central, West North Central, East South Central, and West South Central each have less than 10% of their counties with any of these public lands. The South Atlantic division closely mirrors the overall U.S. distribution with approximately 15% of the counties in this region having some type of public land. Public lands are more than twice as likely to be found in New England, and the Mountain and Pacific divisions both have disproportionate shares of public lands. In both of these divisions, the majority of counties have some type of public land.
Demographic Change in Public Lands Counties
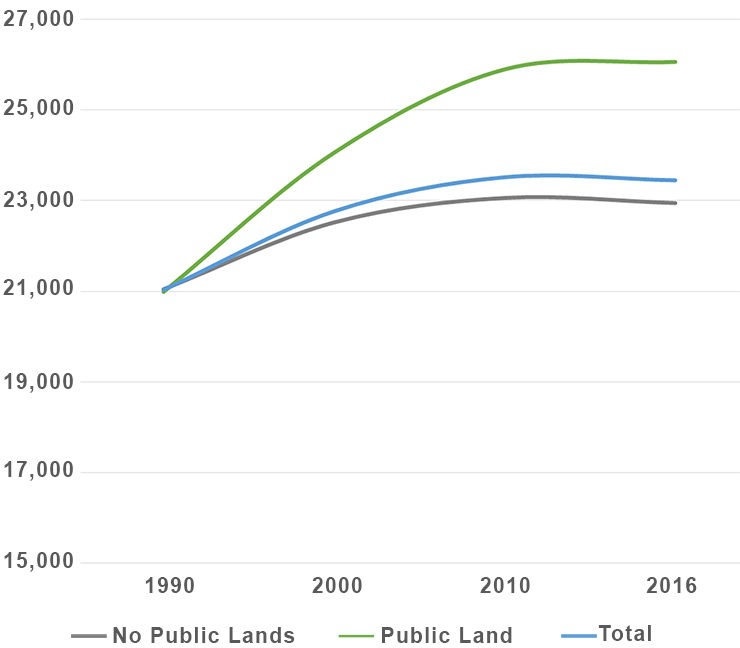
Demographic dynamics over the past 25 years have differed considerably between counties with public lands and those without. In 1990, the average sizes of counties with and without public lands were virtually identical. On average, both types of counties were home to roughly 21,000 residents. The 1990s, however, brought substantially more growth to the public lands counties: by the year 2000, the average public lands county was home to 24,000 residents, 1,500 more than those counties without public lands (Figure 2). The gap in average population size doubled by 2010 with public lands counties having nearly 3,000 more residents than the other set of counties. Coming out of the Great Recession, public lands counties continued to grow in average size albeit more slowly with the average public lands county now exceeding 26,000 residents. In contrast, counties without public lands shrank between 2010 and 2016, losing on average 100 residents.
Figure 2: Average population size of counties with public lands.
A combination of factors contribute to the more rapid growth in public lands counties. There is strong evidence from the 1990s supporting Ullman’s amenities hypothesis. As interest in the Rural Rebound grew during the 1990s, much was made of the rise of the “amenity migrant” as footloose service workers began to act on preferences for rural residences and moved to areas with more access to natural landscapes. These migration streams are well documented in the literature and were often directed toward counties with public lands (see, for example, Löffler and Steinicke 2007, Chi and Marcouiller 2012, Abrams and Bliss 2013). During the 1990s, public lands counties experienced net migration rates of nearly 8% compared with less than 2% for the rest of non-metropolitan America (Figure 3). Migration streams toward public lands counties slowed considerably during the first decade of the twenty-first century to under 1%.
Figure 3: Components of population change.
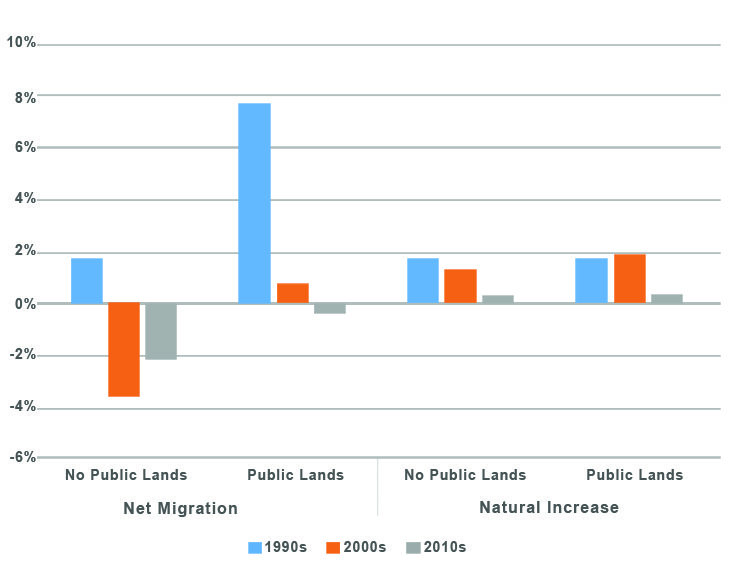
These migration streams, nonetheless, remained positive. The same cannot be said for those areas without public lands. On average, net migration was negative for the remaining counties with net migration losses of nearly 4%. Migration continued to slow in the wake of the Great Recession (Cooke 2013), and now public lands counties have on average net migration streams that are effectively zero while counties without public lands on average continue to lose population to migration at a roughly 2% rate.
As migration slows across all types of counties, natural increase has become a relatively more powerful contributor to population change. Migration rates peak for populations in their 20s, so areas with large positive net migration rates tend to also have populations with younger age structures producing higher birth and lower death rates. The interplay of these demographic dynamics generates higher rates of natural increase across counties with public lands (Figure 3). In fact, since 2000, rates of natural increase surpass net migration rates in both types of counties, so the continued overall population growth in public lands counties this century is less a result of continued positive net migration and more a product of births outnumbering deaths. Since 2010, natural increase has been able to offset the very small level of net out-migration in public lands counties. In contrast, counties without public lands are decreasing in size because the small positive natural increase is unable to counter the relatively large rates of out-migration.
The variations in components of demographic change are both an influence on and influenced by somewhat distinct demographic structures differentiating counties with public lands from those without. In the 1990s, public lands counties were not just younger than those without public lands, they were also considerably more diverse. The 1990s brought sizeable flows of Latinx migrants to rural destinations across the country, and these new destinations were heavily concentrated in the Southeast and Rocky Mountains (Kandel and Cromartie 2004). Several explanations exist for these new migration streams into rural destinations, including one that demonstrates how in many amenity destinations, Latinxs provide the workforce to build the new houses, wash the dishes, and mow the lawns for the Anglo amenity migrants (Nelson and Nelson 2011).
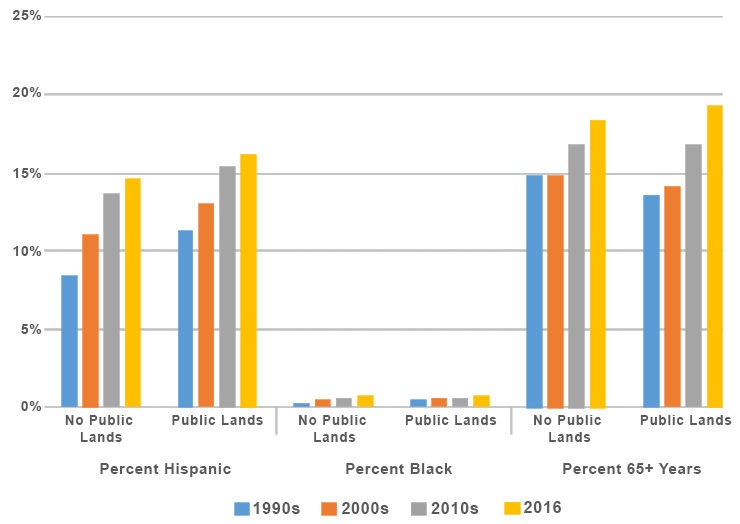
Figure 4: Demographic composition of counties with and without public lands.
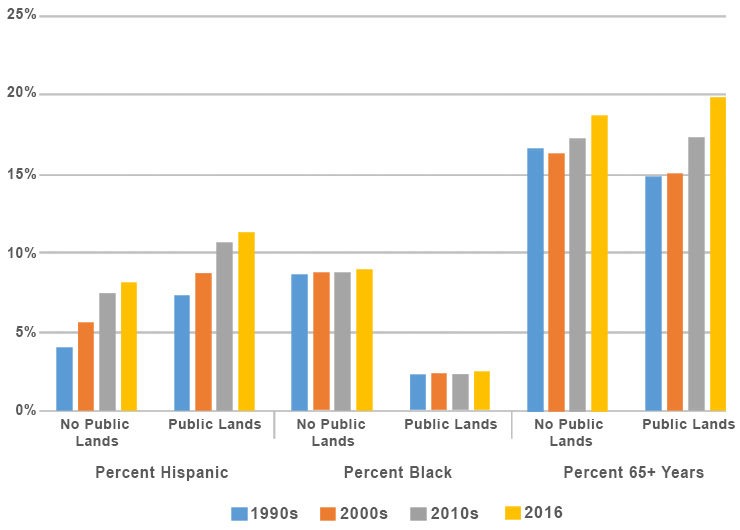
Figure 4 compares the demographic structure of the two types of counties and reveals a few important distinctions. First, the black population is more concentrated in counties without public lands, and this distribution has not changed over the last two-and-a-half decades. Second, the Latinx population was more concentrated in public lands counties in 1990, and in both types of counties the Latinx population has grown consistently over the last 25 years. Today, on average, more than one in 10 residents of a public lands county identifies as being Latinx. Finally, while in 1990 public lands counties were somewhat younger than the rest of nonmetropolitan America with less than 15 percent of their populations over age 65, by 2016 public lands counties were slightly older. These most recent data indicate nearly one in five residents of nonmetropolitan public lands counties is over age 65. Moreover, the aging of public lands counties has been more rapid going from 15% over the age of 65 in 2000 to 20% by 2016. This aging of public lands counties likely reflects the continued attraction of public lands for retirement migration as well as the aging in place of earlier waves of migrant baby boomers arriving as 40- to 50-year-olds in the 1990s (Nelson and Cromartie 2009).
The West Versus the Rest
Given the uneven regional distribution of public lands (Figure 1), it is possible that the differences in population dynamics and structure revealed above result less from the presence/absence of public lands and are more the product of broader regional differences in population change. In other words, maybe the West is simply different and because the West has more public lands this “regional effect” is distorting the results. To account for this possibility and control for potential regional effects, Figures 5, 6, and 7 (below) present the same comparisons reported above but are limited to only counties within the West, effectively controlling for region. Briefly, the differences revealed above remain when the analysis focuses exclusively on the West, suggesting that the distinct demographic structures and dynamics in public lands counties do not reflect the uniqueness of the West as a region. Rather, even within the West, public lands counties tend to have larger populations and have experienced more positive net migration in the 1990s and early 2000s. Within the West, public lands counties also tend to have somewhat higher shares of Latinx residents (though the gap has narrowed considerably since 1990). Finally, similar to the national set of counties, populations in public lands counties in the West were younger than their counterparts in 1990, but today are slightly older, with nearly 20% of their populations over the age of 65.
Figure 5: Average population size by county type, western counties only.
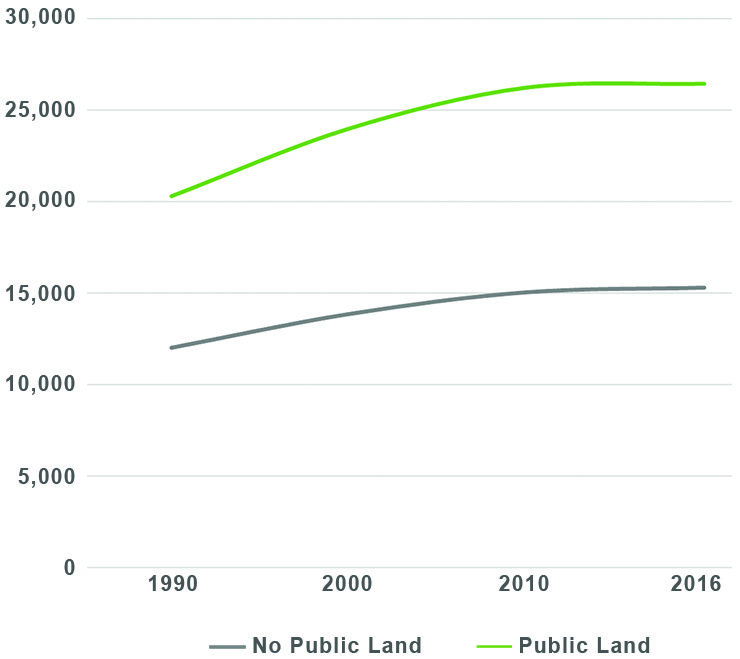
Figure 6: Components of population change by county type, western counties only.
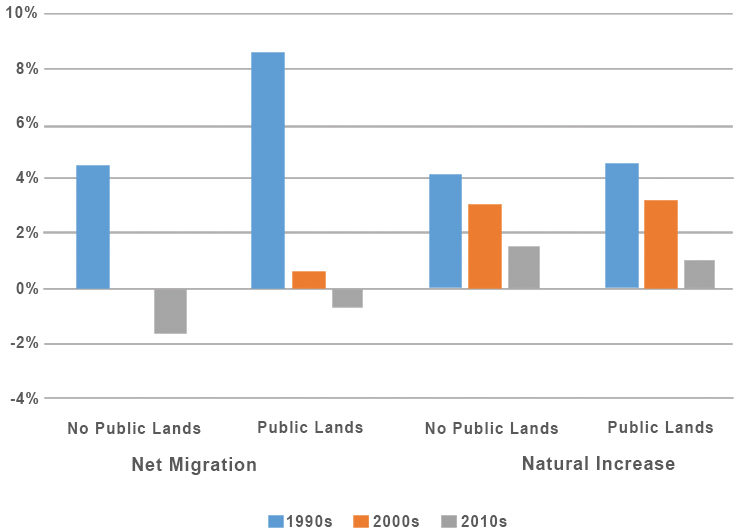
Figure 7: Demographic composition by county type, western counties only.
Conclusion – Dynamism and Difference Characterize Public Lands Counties
Across the United States and within the West, the demographic structure and components of change distinguish counties with national parks, designated wilderness areas, national monuments, and/or national recreation areas from those without these types of public land resources. Public lands counties tend to be somewhat larger, more diverse, and today are slightly older. Moreover, the analysis reveals how the components of change in these counties differ as well. Public lands counties enjoyed considerably higher levels of in-migration during the Rural Rebound of the 1990s compared to the average county without public lands. Since the 1990s, the extremely high levels of positive net migration subsided in the first decade of the 2000s in public lands counties. Nonetheless, these areas retained positive net migration while the rest of nonmetropolitan America experienced net out-migration. Interestingly, today natural increase plays a much larger role in driving demographic change in public lands counties than it did just 15 or 20 years ago.
Going forward, several key questions remain for scholars interested in the relationship between public lands and population dynamics in nearby communities:
- How do the increasingly diverse populations living in nearby counties value and interact with our public lands?
- As the populations living in public lands counties continue to age, how will their utilization of public lands change, and what infrastructure and systems will be needed to enable continued access to valued public lands for this aging population?
- Given the ongoing immigration policy debates at the federal level, what labor market vulnerabilities exist in public lands counties increasingly reliant on immigrant/Latinx workers?
- With declining migration and stabilizing natural increase, how do public lands counties build sustainable economies not based to such a large degree on growth?
Suggested Reading
- Abrams, J. and J.C. Bliss. 2013. Amenity Landownership, Land Use Change, and the Re-Creation of “Working Landscapes.” Society and Natural Resources 26(7): 845-859.
- Chi, G. and D.W. Marcouiller. 2012. Recreational homes and migration to remote amenity-rich areas. Journal of Regional Analysis and Policy 42(1): 47-60.
- Cooke, T.J. 2013. Internal migration in decline. Professional Geographer 65(4): 664-675.
- Gosnell, H. and J. Abrams. 2010. Amenity migration: diverse conceptualizations of drivers, socioeconomic dimensions, and emerging challenges. GeoJournal 76(4): 1-20.
- Kandel, W. and J. Cromartie. 2004. New Patterns of Hispanic Settlement in Rural America. Washington, DC: USDA Economic Research Service.
- Löffler, R. and E. Steinicke. 2007. Amenity migration in the U.S. Sierra Nevada. Geographical Review 97(1): 67-88.
- Nelson, L. and P.B. Nelson. 2011. The global rural: Gentrification and linked migration in the rural USA. Progress in Human Geography 35: 441-459.
- Nelson, P.B. and J.B. Cromartie. 2009. Baby Boom Migration and its Impact on Rural America. Economic Research Report #79. Washington, DC: USDA Economic Research Service.
- Power, T. and R. Barrett. 2001. Post-cowboy Economics: Pay and Prosperity in the New American West. Washington DC: Island Press.
- Ullman, E. 1954. Amenities as a factor in regional growth. The Geographical Review 44: 119-132.
