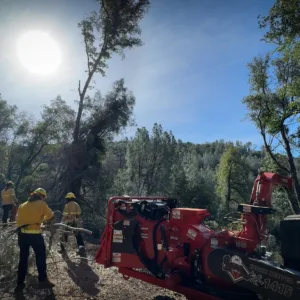
The USDA Forest Service’s Community Wildfire Defense Grant (CWDG) program is the first of its kind to provide dedicated support for wildfire risk reduction planning and projects on nonfederal land. Authorized by the 2021 Infrastructure Investment and Jobs Act, the program has completed its third round of funding.
Headwaters Economics has conducted an independent analysis of the first three rounds of CWDG funding, building on our previous assessments of Round 1 and Round 2, which found CWDG uniquely effective at reaching rural and low-income communities. The new Round 3 data show intensifying demand, continued success in reaching priority communities, and a maturing pipeline from planning to implementation.
Rising demand demonstrates a funding gap for wildfire risk reduction
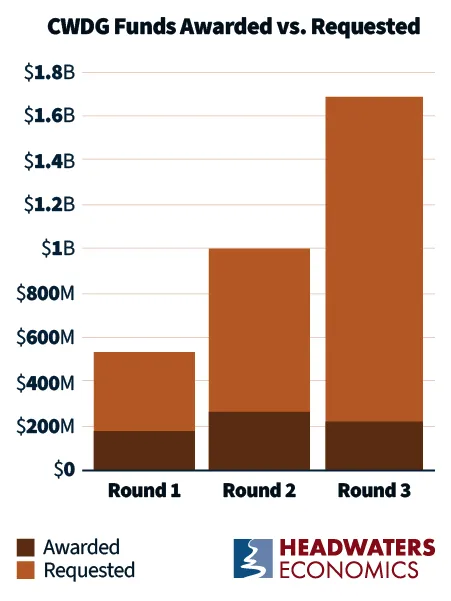
Demand for the CWDG program has accelerated significantly since its inception. While annual funding has remained constant at approximately $200 million per cycle, total requested amounts have increased by 200%. Across three rounds of grants, the demand for funding outstrips available dollars at a rate of five-to-one. In the most recent round (Round 3), requests for funding outstripped available dollars at a rate of eight-to-one.
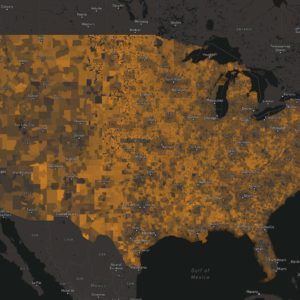
More than 300 CWDG grants have been distributed across 27 states and Puerto Rico, reflecting broad national support for the program. Applications for these grants fall into two primary categories. Implementation-related Project Applications support on-the-ground risk reduction activities such as creating defensible space around homes, fuels treatments, or improvements for water systems, emergency access, and equipment. The other category of proposals, Community Wildfire Protection Plan (CWPP) Applications, supports wildfire resilience planning for fire departments and local officials.
Implementation grants (up to $10 million per award) face the steepest competition, with a 17% award rate compared to 27% for planning grants (up to $250,000 per award).
CWDG Applications and Awards in Rounds 1-3
| CWDG Rounds 1-3 | CWPP Applications | Project Applications | Total | |
| Number | Awarded | 161 | 155 | 316 |
| Applied | 595 | 929 | 1,524 | |
| % Awarded | 27% | 17% | 21% | |
| Dollar amount | Awarded | $28,558,925 | $609,689,665 | $638,248,590 |
| Applied | $118,113,672 | $3,122,492,682 | $3,240,606,354 | |
| % Awarded | 24% | 20% | 20% | |
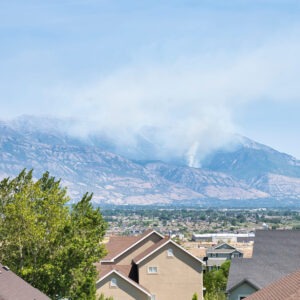
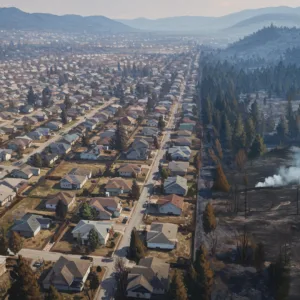
The high demand for CWDG funds reflected in this data has many possible drivers, including rising insurance rates related to wildfire risk, development trends that are placing more homes in high-risk areas, and a growing recognition that mitigation is a cost-effective way to prevent or reduce the likelihood of costly wildfire disasters.
CWDG is empowering high risk, low-income, and rural communities
The CWDG program is hitting its legislative mandates by prioritizing high-risk, underserved communities. The majority of grants have been awarded to high-risk, low-income communities. In Round 3, 100% of awards were directed to communities meeting all three statutory priorities: high or very high wildfire risk, low-income status, and locations recently impacted by a severe disaster.
Additionally, nearly three out of every four dollars were awarded to nonmetropolitan, rural counties. Low- and medium- capacity communities (those with fewer resources or limited government staff) demonstrated a higher success rate (25%) than high-capacity applicants (17%). This distribution differs significantly from other federal mitigation funds. For example, the FEMA Building Resilient Infrastructure and Communities (BRIC) program directed just 4% of its funding to low-capacity communities.
The CWDG program has established several unique models that contribute to its success in reaching high-risk, high-need communities. The easy-to-use CWDG dashboard provides all communities with the data necessary to apply for grants. Data access can be a significant hurdle for rural communities with a lack of dedicated GIS staff or technical experts to manage complex federal applications. The CWDG dashboard reduces the burden on applicants, allowing rural communities to submit competitive, data-driven proposals without the cost of hiring staff or consultants.
In addition, the Community Navigators Program serves as a vital bridge between federal resources and local implementation. This nimble program, supported by the Department of Agriculture, provides specialized technical assistance to communities at no cost. For example, the Coalitions and Collaboratives organization—part of the Community Navigators program—has successfully guided communities to secure more than $64 million in CWDG awards across Rounds 2 and 3.
The agility of the Navigator model was most evident during the 2025 federal government shutdown. While Forest Service employees were limited by work stoppages, the Community Navigators provided webinars, information sessions, and administrative guidance. This ensured that critical wildfire planning for rural and tribal partners did not stall, even when federal personnel were unavailable.
Wildfire planning investments create a pipeline for risk reduction projects
A critical component of the CWDG program is its ability to transform high-level planning into risk reduction results on the ground. Up-to-date, multi-agency Community Wildfire Protection Plans (CWPPs) are statutory prerequisites for CWDG implementation grants and other federal funding programs, serving as a foundational roadmap for local wildfire risk reduction. CWDG grants help ensure that these plans do not sit on a shelf.
To evaluate the planning-to-implementation pipeline, Headwaters Economics conducted an analysis of the types of activities included in each proposal. While planning is a foundational activity, appearing in approximately three-quarters of successful grants, it is rarely a standalone endeavor. Instead, it often appears in combination with high-impact work like capacity building, education and outreach, fuel treatments, or water resource improvements. After planning, fuel treatments are the second most common activity, appearing in more than 60 percent of successful grants.
The integration of planning and implementation activities suggests that planning is not being used as a bureaucratic exercise. Rather, planning is consistently used to deliver tangible risk-reduction work to the most vulnerable communities.
Proposed Activities in CWDG Applications, Rounds 1-3
| Rank | Activity | Number of Grants | % of Awarded Grants |
| 1 | Planning: CWPP development, risk assessments, and strategic roadmaps | 247 | 78% |
| 2 | Fuel Treatments: Mechanical thinning, vegetation removal, and prescribed fire | 192 | 61% |
| 3 | Education/Outreach: Workshops, websites, community engagement, and awareness programs | 124 | 39% |
| 4 | Defensible Space: Home hardening and vegetation management specifically around structures | 103 | 33% |
| 5 | Equipment and Systems Improvements: Physical system improvements, water resources, emergency access, and equipment | 90 | 28% |
| 6 | Capacity Building: Capacity Building: Hiring coordinators, staff training, and partnership development | 74 | 23% |
The future of CWDG
The demand for Community Wildfire Defense Grants has consistently and increasingly exceeded available resources, demonstrating the broad need for proactive investments in fire mitigation and prevention. Investments in data accessibility and technical assistance has helped ensure that rural communities can access the CWDG program. The initial authorization of $1 billion from Congress will be exhausted in the next round of CWDG funding. Without reauthorization or additional appropriations, the upcoming fourth round is projected to be the final cycle for this program, despite its success in reaching some of the highest risk, highest need communities that are committed to avoiding losses from wildfire.
Data Sources and Methods
This analysis used U.S. Forest Service data for Community Wildfire Defense Grants (CWDG) applications from funding rounds 1, 2, and 3. The CWDG Round 1 (FY22) awards were announced on March 21, 2023, the Round 2 (FY23) awards were announced on May 14, 2024, and the Round 3 (FY24) awards were announced on September 23, 2025.
The cost data used in this analysis are from the Community Wildfire Defense Grants Funding Dashboard. These costs include both the actual grant amount plus the match amount for those communities that were not granted a waiver.
The Forest Service data provided the county-level location of each CWDG application. Therefore, the comparison of local capacity among applications was based on county-level Rural Capacity Index percentile ranks.
National wildfire risk data are from the “Risk to Homes” dataset in the Wildfire Risk to Communities project. Applications in counties where the “Risk to Homes” national percentile rank is >70 are considered “high or very high” national wildfire risk.
Low-income data are from each CWDG application, according to the income status levels reported by applicants.
The Rural Capacity Index is from Headwaters Economics, A Rural Capacity Map (2025). The Rural Capacity Index is a measure of whether communities have the staffing and expertise to support infrastructure and climate resilience projects and comprises 12 indicators. Counties are categorized as “low capacity” if their index score ranks in the lower 33% of counties nationwide. Applications from U.S. territories were assumed to be low capacity.
Grant activities were evaluated using an AI-supported (Claude Sonet 4.6) analysis of the “Overview” field in the grants. Each grant’s project overview was scanned for keywords and phrases associated with each category. The keyword rules are explained below and draw on the language commonly used in grant applications to minimize false positives. For example, broad terms like “collaboration” were excluded after testing showed they matched too many unrelated projects; more specific phrases like “partnership development” and “building capacity” were retained. We allowed for multiple categories per grant, which better reflects how most grants bundle several activity types into a single funded project.
The following terms and phrases (or close variants) were used to assign each category. Matches were case-insensitive and applied to the full project overview text.
- Planning (CWPP development, risk assessments, and strategic roadmaps):
- Keywords: CWPP, community wildfire protection plan, wildfire defense/protection/prevention plan, wildfire risk reduction plan, fire management plan, hazard mitigation plan, action plan, planning, risk assessment, develop/create/update a plan, community wildfire protection, wildfire defense
- Education/Outreach (Workshops, websites, community engagement, and awareness programs):
- Keywords: Outreach, education, workshop, engagement, awareness, public information, communicate risk, Firewise program/activities/community, fire-adapted community, technical assistance to homeowners/landowners/residents, educate the public/community, community information, raise/increase/build awareness
- Equipment and Systems Improvements: (Physical system improvements, water resources, emergency access, and equipment):
- Keywords: Infrastructure, evacuation route/road/zone, ingress/egress, emergency access/road/route, right-of-way, power line, utility line/corridor, water system/supply/tank/storage/source, fire hydrant, cistern, fire/emergency station/apparatus/vehicle/truck/engine, distribution line, single-point or single-lane access
- Fuel Treatments (Mechanical thinning, vegetation removal, and prescribed fire):
- Keywords: Fuelbreak, firebreak, hazardous fuels, fuel load/reduction/management/mitigation/removal/treatment, fuels, landscape-scale treatment, thinning, mechanical treatment, prescribed fire/burn, forest thinning/treatment/management/health, tree removal/clearing/thinning, mastication, mowing vegetation, slash pile/treatment/removal, shaded fuelbreak, roadside clearance/clearing, biomass removal, brush clearing, right-of-way vegetation management, vegetation/woody material/brush/tree removal, broadcast burn, cultural burn, wildfire risk/hazard reduction
- Defensible Space (Home hardening and vegetation management specifically around structures):
- Keywords: Defensible space, home hardening, ignition zone, around homes/structures/property, home mitigation/assessment/inspection/retrofit, structure protection/ignitability/assessment, ember-resistant, fire-resistant home/structure/roof/vent, zone 0/zone zero, home ignition zone (HIZ), parcel inspection/assessment, property inspection/assessment/clearance, residential or homeowner clearance/inspection/assessment, structure ignitability
- Capacity Building (Hiring coordinators, staff training, and partnership development):
- Keywords: Coordinator, hiring, hire a coordinator/manager/specialist/director, fund a position, workforce development/training, technical training/certification, prescribed fire training/crew/cadre, volunteer, job training, peer-to-peer guidance/support, partnership, capacity, building/increasing/expanding/developing capacity, community resilience program, local capacity/organization, sustainable program, program coordinator/manager/director