
As job losses related to COVID-19 continue to grow, communities that rely on visitors to sustain tourism-related businesses like restaurants and hotels are particularly hard hit. Many workers in these industries were already struggling to afford housing in the town where they work, especially if that town is in a recreation-dependent county. In growing communities across the United States, unaffordable housing has created a baseline of financial hardship that makes residents less able to weather disruptions from pandemics, natural hazards, and economic transitions.
When recreation-dependent communities begin to consider recovery from the pandemic, they should understand the challenges that accompany an economy dependent on outdoor recreation and craft solutions that anticipate the challenges. One such challenge is the rapid increase in home prices that results in unaffordable housing for some residents.
This research describes the underlying causes of unaffordable housing in non-metro counties and investigates the degree to which recreation-dependent counties, in particular, struggle with housing affordability. See definitions, data sources, and methods below.
How affordable is housing in your community?
Find data for every U.S. county. Compare your county to others in your state. Take the quiz >>
Housing in recreation counties is less affordable.
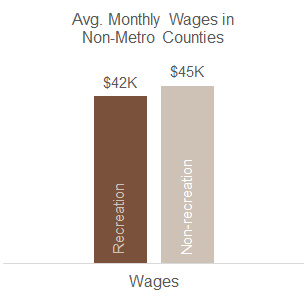
On average, housing costs are higher in recreation counties than in non-recreation counties while wages are lower.
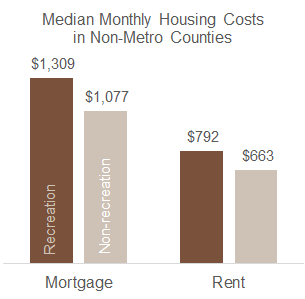
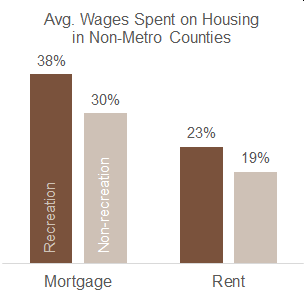
Taken together, these patterns mean that residents of recreation counties pay a significantly larger share of their wages on housing. The average renter in a recreation county pays 23% of their wages on housing (homeowners pay 38%), while the average renter in a non-recreation county pays 19% of their wages on housing (homeowners pay 30%).
Across all non-metro counties, a common set of factors makes housing less affordable.
To better understand the drivers of housing affordability across all non-metro counties, not just recreation-dependent places, we developed a statistical model that controls for measurable factors that underly local economic conditions.
Generally, increases in population, income inequality, high-paying jobs, and other wealth drive up mortgages and rent. These factors are discussed in more detail below. Full details of our methods and model results can be found here.
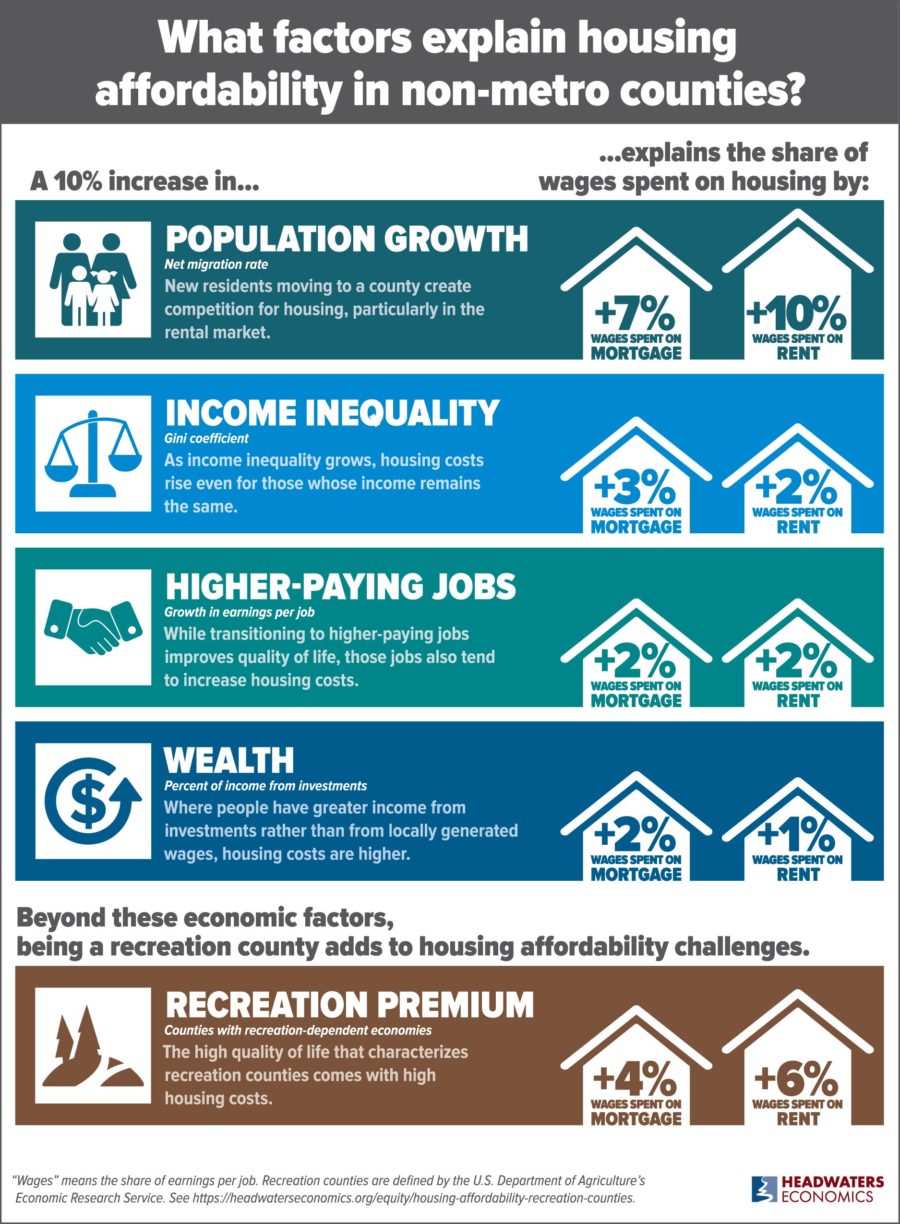
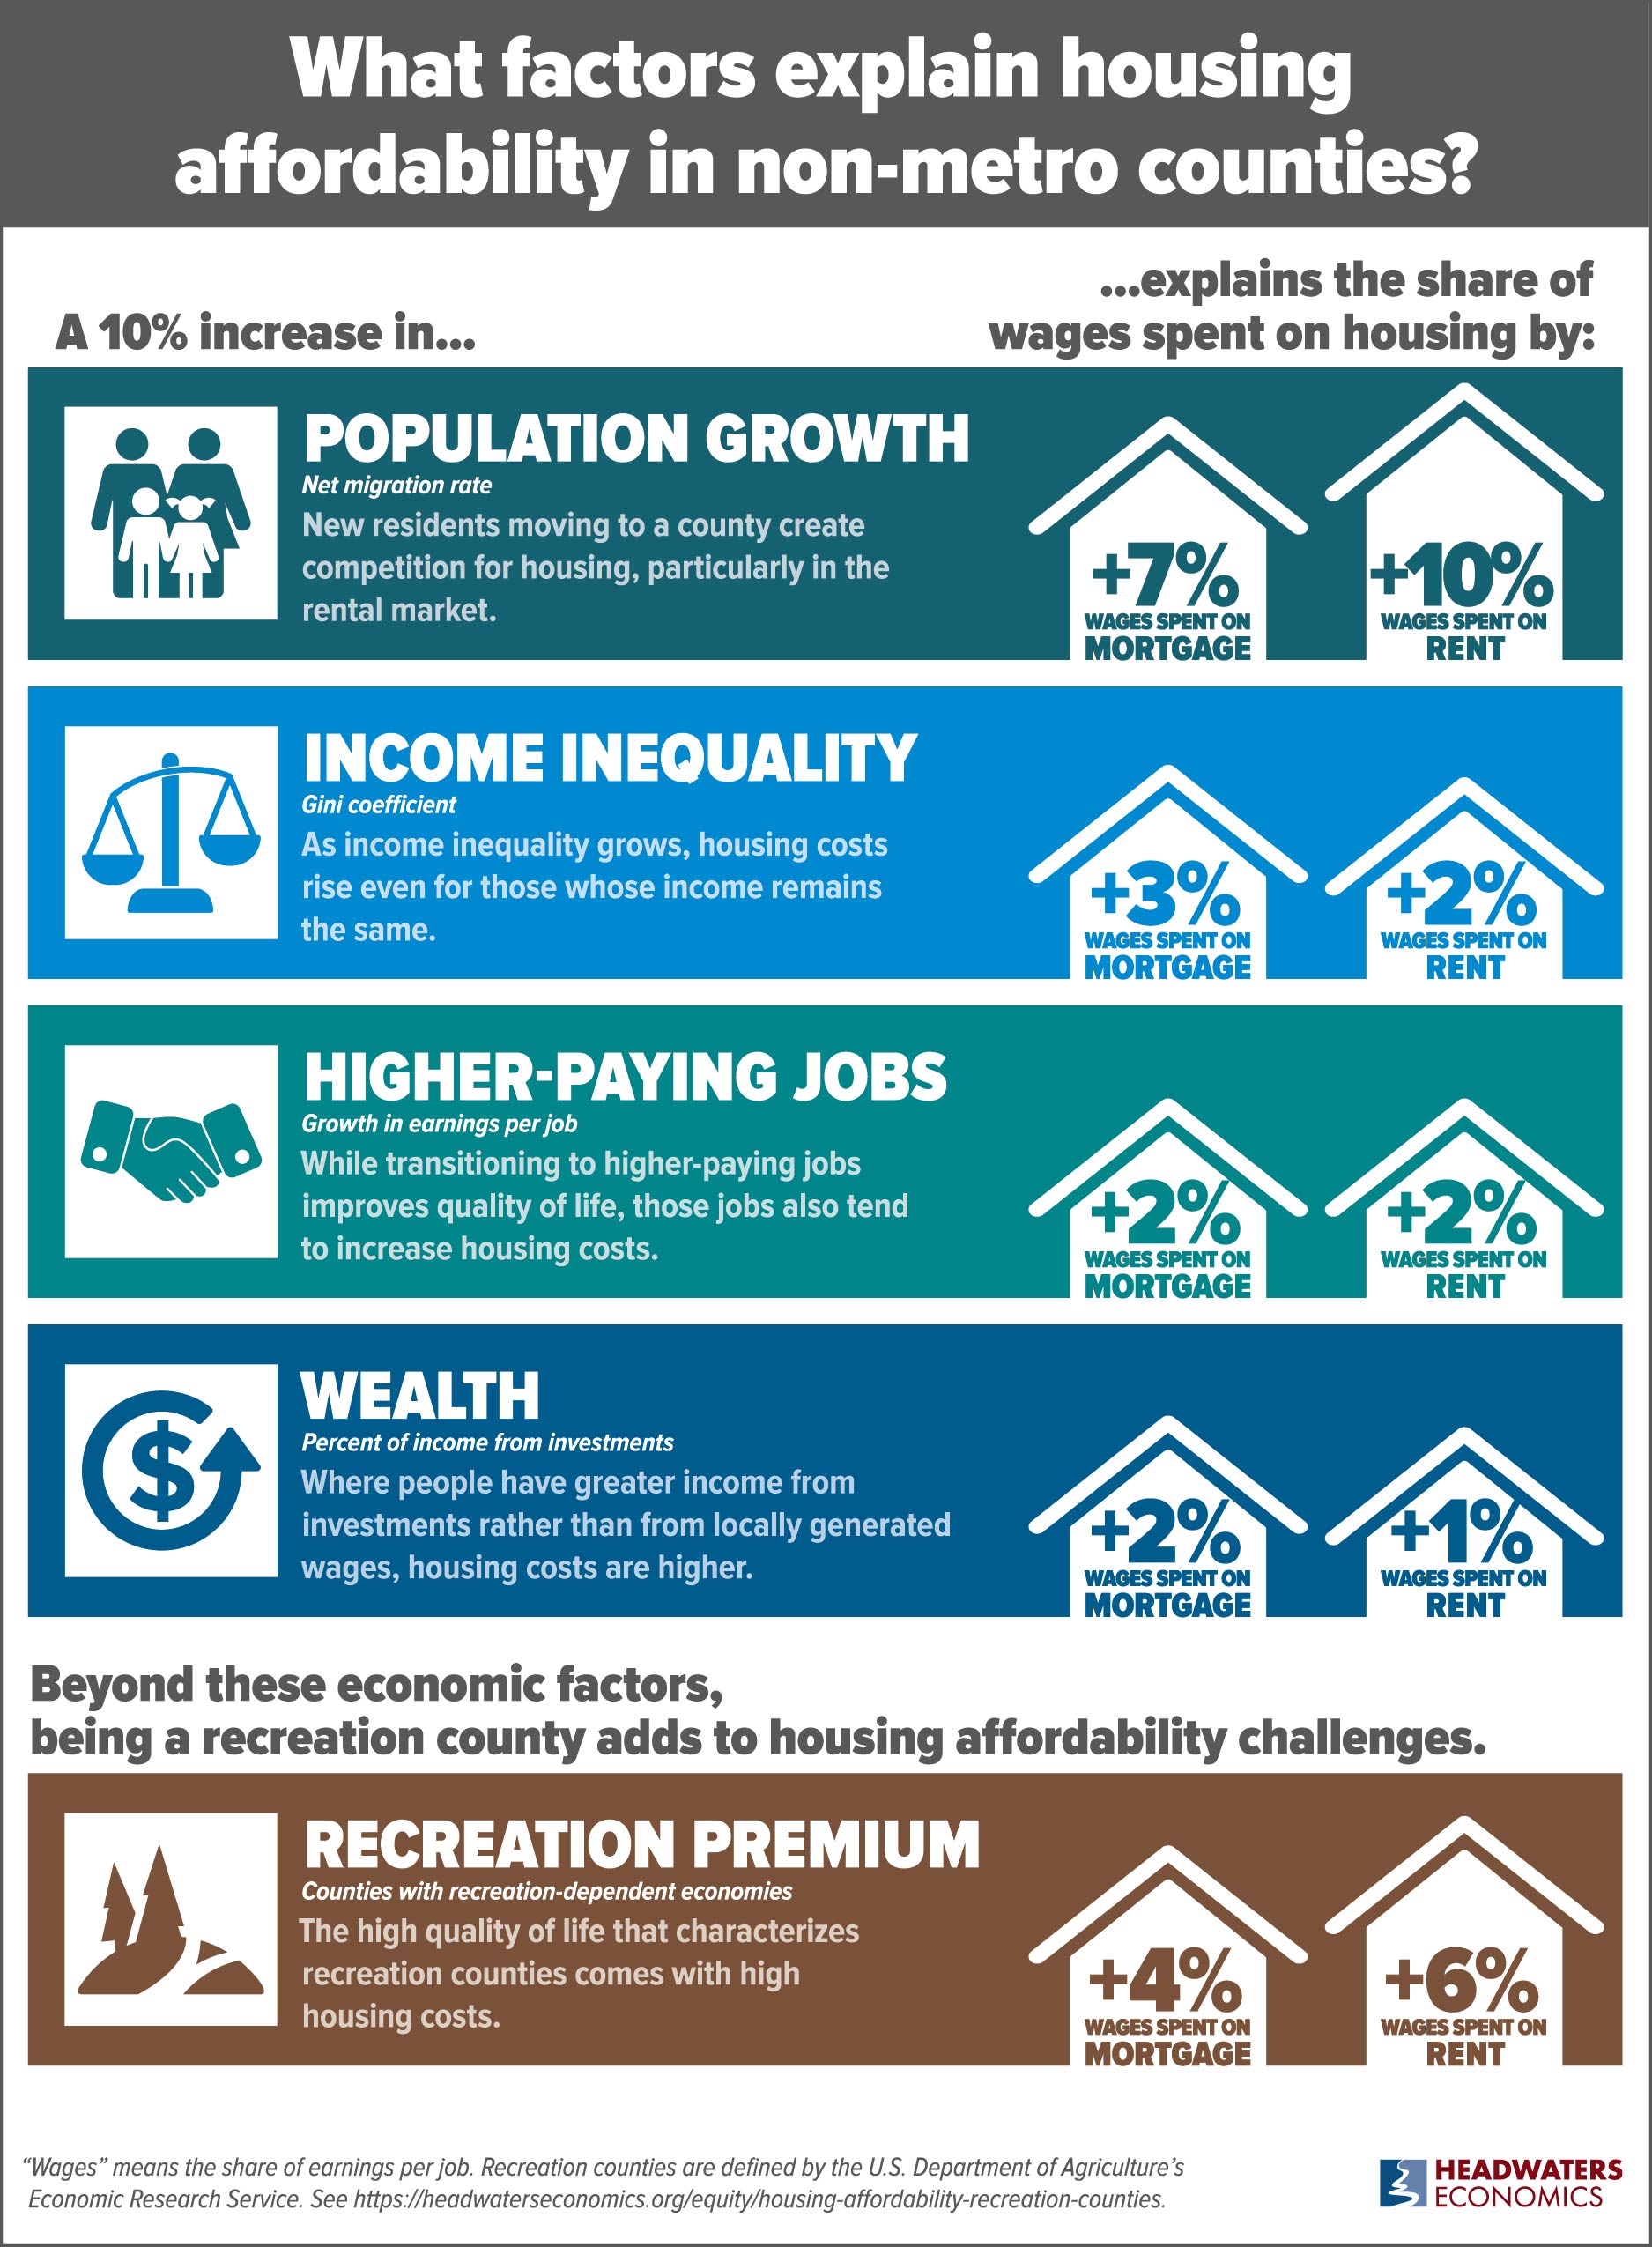
A 10% increase in…
…explains the share of wages spent on housing by:

POPULATION GROWTH
New residents moving to a county create competition for housing, particularly in the rental market.

Rapid population growth from new residents is the strongest predictor of housing affordability. As people move to a community, housing becomes less affordable, particularly for renters. In non-metro counties, as the net migration rate increases by 10%, the share of wages spent on mortgages increases by 7% and the share spent on rent increases by 10%. This relationship likely reflects higher competition for housing, as well as likely speculation by real estate investors buying properties for the rental market.
Since 2010, non-metro recreation counties have seen an average 2% rate of in-migration, while non-metro counties that are not recreation-dependent have experienced a 2% rate of out-migration. This trend may be exacerbated by the pandemic as people leave metropolitan areas for less crowded destinations.
A 10% increase in...
...explains the share of wages spent on housing by:

INCOME INEQUALITY
As income inequality grows, housing costs rise even for those whose income remains the same.

On average, when income inequality increases, housing becomes less affordable. In non-metro counties, a 10% increase in income inequality (measured by the Gini coefficient) is associated with 3% more wages spent on mortgages and 2% more for rent. This relationship likely reflects the rapid growth in income for the top earners, coupled with a decrease in relative housing costs for those same households, which exacerbates increasingly unequal income. At the same time, housing costs rise for the lowest-income households despite little to no income growth.
Non-metro recreation counties, on average, have enjoyed less income inequality than their non-recreation counterparts, helping to mitigate the influence of other pressures raising housing costs.
A 10% increase in...
...explains the share of wages spent on housing by:

HIGHER-PAYING JOBS
While transitioning to higher-paying jobs improves quality of life, these jobs also tend to increase housing costs.

Increasing wages accompany growth in higher-wage sectors such as technology and professional and scientific services, as well as booms in natural resource extraction. We find that non-metro counties with wages growing 10% faster between 2010 and 2018 have, on average, 2% greater share of wages going toward housing. This suggests that in places where wages are growing rapidly, competition for limited real estate may drive up housing costs faster than wages.
Non-metro recreation counties typically enjoyed faster growth in wages between 2010 and 2018 when compared to non-recreation counties. However, the associated decline in housing affordability is a clear downside.
A 10% increase in...
...explains the share of wages spent on housing by:

WEALTH
Where people have greater income from investments rather than from locally generated wages, housing costs are higher.
Investment income makes housing less affordable, especially for homeowners. The greater the share of income in a community that comes from investments (dividends, interest, and rent), the less affordable housing tends to be for mortgage-holders and renters. Our model finds the share of wages spent on housing increases by 2% for homeowners and 1% for renters for every 10% increase in the community’s share of personal income from investments.
Households with substantial investment income are not tied to the local labor market, which distorts the relationship between housing costs and local wages and increases the cost of housing relative to income from jobs. Many of the non-metro recreation communities with a high share of investment income are also retirement destinations, such as San Juan County, WA, where investment income makes up 53% of all income and the median mortgage consumes 64% of wages for the average job.
Knowing that investment income is strongly related to less affordable housing is important because many non-metro recreation counties are attracting people with substantial personal wealth in the form of investment income. The qualities that attract tourists and recreationists also attract wealthier people with investment income.
Beyond these economic factors, being a recreation county adds to housing affordability challenges.

RECREATION PREMIUM
The high quality of life that characterizes recreation counties comes with high housing costs.

Our statistical model allows us to isolate the intangible “recreation premium” associated with the higher quality of life and natural, cultural, and recreational resources in recreation communities. In technical terms, the “recreation premium” is the remaining effect on housing affordability in non-metro recreation counties after controlling for the previously described, easily measurable factors such as growth in wages and new people moving in.
After accounting for measurable community factors, residents of non-metro recreation counties pay a higher share of wages on housing: 4% higher for mortgages and 6% higher for rents on average.
Importantly, not only do non-metro recreation counties have a “recreation premium” that may contribute to less affordable housing, they also often have more people moving to the county, more investment income, and greater growth in wages —all of which are linked to less affordable housing. Policy solutions to improve housing affordablity are especially important in non-metro recreation counties.
Solutions for Recreation Communities
Housing affordability is a pressing policy question facing local and national leaders in growing communities of all types. Community leaders in existing and emerging recreation destinations should anticipate housing affordability problems that often accompany the high quality of life that characterizes recreation towns. The pressures described in this research are likely to be further exacerbated as residents of urban areas hard hit by the COVID-19 pandemic seek less densely populated communities.
Housing supply rarely keeps pace with population growth in all kinds of booming communities, from tech hubs to oil and gas boomtowns to recreation destinations. As communities consider a range of strategies to improve affordability, those that boost supply may be prioritized. But simply adding new units is not enough: new housing units affordably priced for lower-income households are needed to serve those most burdened and avoid exacerbating housing inequality.
Our findings point to growing wealth as an important driver underlying unaffordable housing. Local policies cannot prevent an influx of investment income, but can track this so-called “non-labor income” as a bellwether for affordability challenges. State policies regarding capital gains tax and how it is spent can redistribute revenue to support affordable housing programs.
The findings from this research show that recreation economies are connected to substantially greater housing cost relative to local wages, even after controlling for other economic and housing supply factors. Because recreation economies also tend to have high levels of the economic factors like investment income that contribute to housing cost burden, the effect of the recreation premium is amplified. For growing recreation communities, fiscal and zoning policy solutions that address housing supply and second homes can help to mitigate the impact of the recreation premium.
Incentives to increase housing supply include eliminating minimum house size requirements, waiving impact fees for affordable housing units, and providing tax credits for denser housing. Regulations include required employer-sponsored housing and zoning policies to allow multi-family housing or require a share of affordable housing in every development.
While this research sheds light on some of the underlying factors that affect housing affordability for workers, it does not address all components of the problem, such as local zoning regulations that affect housing supply and how well housing supply in growing communities matches the needs of workers and families, particularly those earning the least.
Community Examples
Many recreation destinations have been applying a toolkit of creative regulatory and incentive-based strategies to tackle this problem.
Individual organizations such as community land trusts in Moab, UT, Orcas Island, WA, and Jackson Hole, WY, seek to increase the supply of low-cost housing. Employers such as Vail Resorts and Aspen Ski Company raised minimum wages for employees to $15 per hour.
Regional housing authorities in communities such as Summit County, CO, Blaine County, ID, and Aspen, CO, help to coordinate workforce housing strategies on a regional basis.
A tax on the assessed value of second homes has been implemented in Vancouver, Canada, and is being considered in other places.
This study demonstrates that less affordable housing often goes hand-in-hand with economic growth and prosperity. Communities struggling with housing that is affordable for residents can learn about policy solutions in greater depth here, and more about workforce housing here.
Definitions, Methods, and Data Sources
For complete methods and data sources, see this report.
There are many ways to evaluate the cost burden of housing. While this analysis focuses on housing affordability for workers, alternative definitions have been used by agencies and researchers. The U.S. Department of Housing and Urban Development considers households paying more than 30% of all income (not limited to wages) on housing as “cost burdened.” Other researchers address housing supply for extremely low income households, the wage needed to afford the average home, or “residual income” as the money remaining after housing is paid.
We define "housing affordability" as the share of earnings per job used to pay for monthly mortgages or rent. This measure captures the relationship between working residents’ income and housing. In the rest of this post the term “wages” refers to monthly earnings per job, as provided by the Bureau of Economic Analysis.
"Non-metro” counties are places without a city of 50,000 or more residents and without a large share of residents commuting to large cities, as defined by the Office of Management and Budget. We exclude metro counties from this analysis because their housing markets and economies are more complex and require a different modeling strategy than non-metro counties.
We define “recreation counties” using the definition for recreation dependence by the U.S. Department of Agriculture’s Economic Research Service. ERS’s definition is based on employment and earnings from tourism-related sectors and a high share of seasonal and vacation housing.
For complete details regarding data and statistical methods download the methods report.