
The timeline of U.S. electricity generation capacity additions and retirements shows that a clear transition from coal to natural gas and renewable energy is playing out across the country. Planned retirements and additions of electricity generators will continue the historic trends.
Early evidence suggests that the coronavirus pandemic is accelerating the energy transition. This is because renewable energy plants (wind and solar) tend to have fixed costs and no marginal costs, and natural gas prices, already low, have decreased during the pandemic, making it difficult for coal to compete.
The three figures below show how electricity generation capacity is changing by energy source (coal, natural gas, and renewables). The fourth figure allows users to search by state and energy source.
The figures below show the annual change in national electricity generation capacity (measured in megawatts [MW]) of different fuels sources. In any year, a vertical bar above zero indicates more capacity added from new construction than lost from power plants closing. A vertical bar below zero indicates more capacity lost from power plants closing than added from new construction. These figures include planned changes in electricity generation capacity reported up to the year 2030. See the Methods section at the end for data sources.
Subscribe to our newsletter!
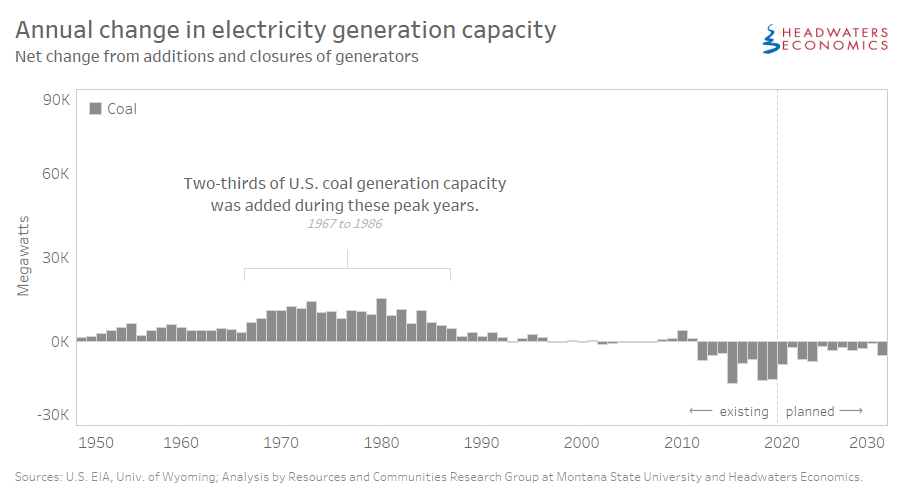
Coal-powered electricity generation capacity increased significantly in the 1970s and 1980s
The United States built many coal-fired power plants during the 1970s and 1980s to meet growing electricity demand. National energy policy, responding to concerns about global oil supplies in the 1970s and worries about scarcity of natural gas, favored coal as a domestic and reliable power source. During the two-decade “big buildup” of coal-fired power plants between 1967 and 1987, the United States added 202,416 MW—about two-thirds of the nation’s total coal-generating capacity.
More recently, new air quality emissions standards and increasing maintenance and replacement costs have led to the retirement of many aging coal-fired power plants. As a result, the nation’s capacity to generate electricity from coal is declining. Coal-fired power plant retirements between 2012 and 2030 will reduce capacity by 115,410 MW, more than a third of the former peak capacity to generate electricity from coal.
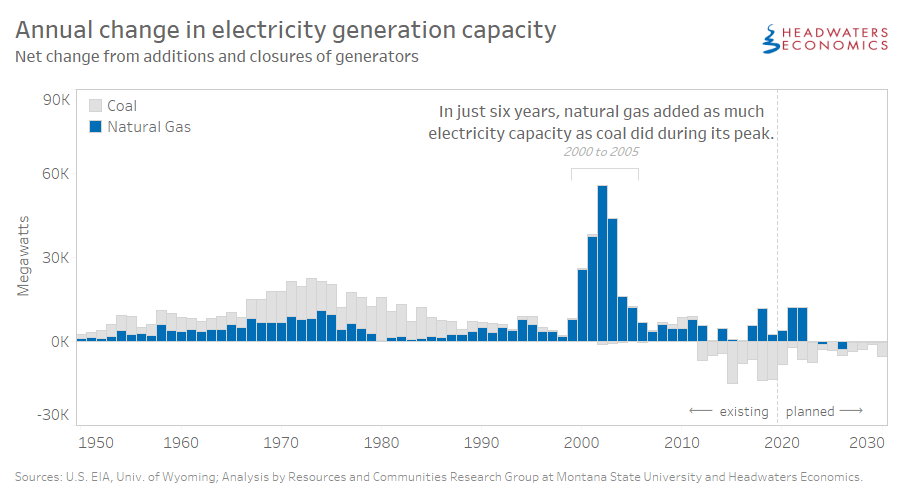
Natural gas capacity replaced coal in the 2000s
Advancements in seismic imaging, horizontal drilling, and fracking techniques reversed concerns about scarcity in natural gas markets and vaulted the United States into the largest global producer of natural gas. The increased volume of production led to persistent low natural gas prices and a building boom in new high-efficiency combined-cycle natural gas and steam power plants that hastened the retirement of many coal-fired power plants. In just six years between 2000 to 2005, 191,745 MW of natural gas capacity were added and natural gas replaced coal as the nation’s baseload power that provides enough electricity to meet minimum level of demand.
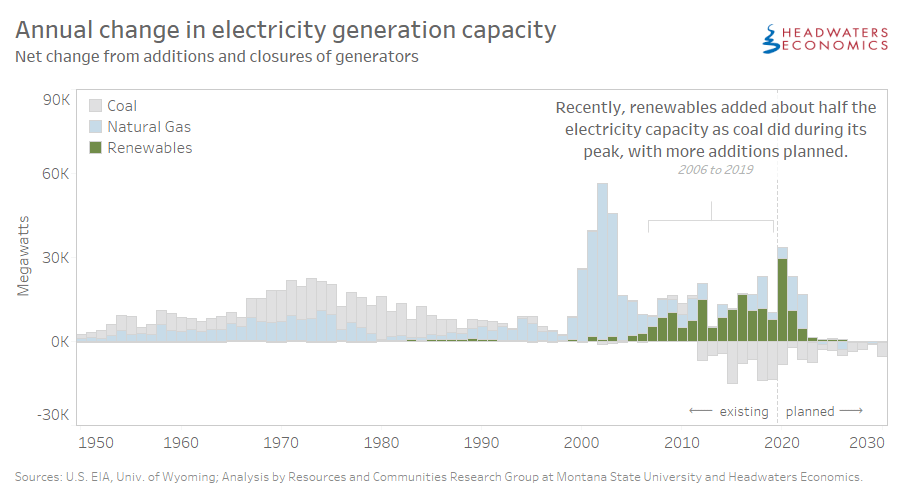
Today renewables are increasing
Renewable energy costs are primarily determined by long-term power purchase agreements, and are less driven by fossil fuel prices (e.g., coal and natural gas). Today, solar and wind energy generators are being built faster than any other energy source. Between 2012 and 2020, natural gas added 35,302 MW of capacity while new wind, solar, and biomass generators totaled 891,383 MW of capacity. Added renewable electricity capacity generated more electricity than coal for multiple days in April 2020—the first time ever that renewables surpassed coal generation on a daily basis. State regulations and incentives driven by climate policy and declining energy costs are influencing the rise of renewables as a growing component of energy markets.
Explore electricity generation capacity by type and state
In the interactive visualization below, select the electricity generation source and state using the drop-down menus. You can also download the data.

Also read this companion post about the changing geography of U.S. electricity generation.
Methods & Data Sources
This data project is part of a collaboration with researchers and students at the University of Wyoming and Montana State University to aggregate public data published by various sources and make it more accessible to decision-makers and the public. Data are from the U.S. Energy Information Administration Preliminary Monthly Electric Generator Inventory (EIA 860-M), including data on retired, operating, and planned power generators. Additional data on coal-fired power plant closures are compiled by Robert Godby and his students at the University of Wyoming. Analysis is by Headwaters Economics and the Resources and Communities Research Group WAFRX project at Montana State University. WAFERx is supported by the National Science Foundation under the EPSCoR Track II Cooperative Agreement No. OIA-1632810.