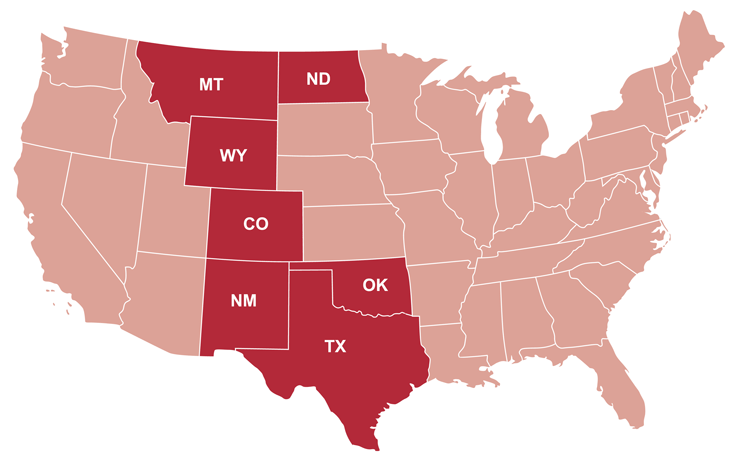
The goal is to show how well each of the states returns oil and natural gas production tax revenue to local governments to help them mitigate impacts and plan for long-term economic development. We also provide specific reports for seven of the states in the above toolbar.
Horizontal drilling and hydraulic fracturing technologies have led a resurgence in oil and natural gas production in the U.S. These unconventional plays require more wells to be drilled on a continuous basis to maintain production than comparable conventional fields. This expands potential employment, income, and tax benefits, but also heightens and extends public costs.
Fiscal policy is important for local communities for several reasons. Mitigating the acute impacts associated with drilling activity and related population growth requires that revenue is available in the amount, time, and location necessary to build and maintain infrastructure and to provide services. In addition, managing volatility over time and making long-term investments in communities requires different fiscal strategies, including setting aside a portion of oil revenue in permanent funds.
Summary Findings
- Tax structures and effective tax rates are highly variable between states.
States levy different taxes at different rates, and offer a range of exemptions, deductions, and incentives. Effective tax rates on new unconventional oil wells, for example, vary between states from a low of 3.3 percent in Oklahoma to a high of 11.7 percent in Wyoming (Figure 1 below).
- Returns to local governments are not consistent with the size of total tax collections.
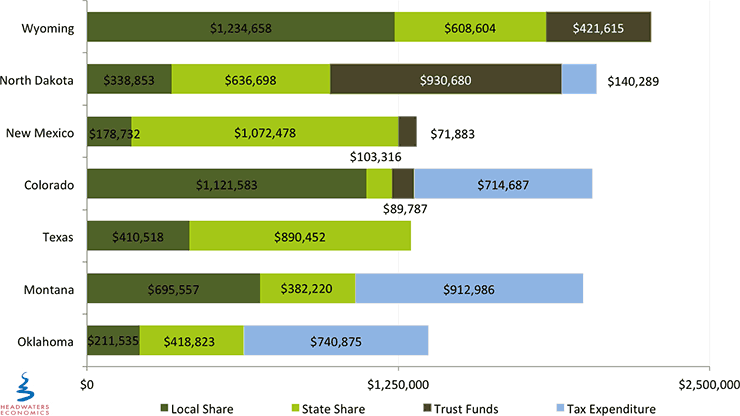
Local governments in states with higher tax rates do not necessarily receive more money. Local returns vary from a low of $178,782 per well in New Mexico to a high of $1,234,658 per well in Wyoming—14 percent and 55 percent of total revenue, respectively (Figure 2 below).
- The lag between when drilling occurs and when revenue is received is longer for local governments than states.
Tax policies can increase the inherent lag between the impacts that occur during the drilling process and the revenue that accrues only after production begins. Local government property taxes, for example, extend time lags between development impacts and revenue collections to between one and three years. On the other hand, state production taxes are most often levied monthly and return revenue more quickly.
- Few states use fiscal policy to resolve uneven revenue distribution to cities and counties.
Local taxes and direct distributions primarily accrue to jurisdictions based on the location of production. Adjacent cities, counties, schools, and special districts, which often absorb significant demographic and other impacts, can be left without sufficient revenue. Only North Dakota and Colorado allocate revenue based on a broader distribution of impacts.
- Most states do little to manage volatility or allocate revenue to long-term savings.
Western states typically do not distribute revenue to a permanent trust fund. North Dakota and Wyoming save substantial amounts of production revenue (43% and 19%, respectively) while others save little (New Mexico 5%, Colorado 5%) to none (Montana, Oklahoma, and Texas), choosing instead to spend revenue as it comes in. In states that do save, local governments do not share in the investment income, leaving them reliant on annual revenue and exposed to volatility.
Charts
Figure 1. Comparison of Production Tax Revenue Collected from a Typical Unconventional Oil Well
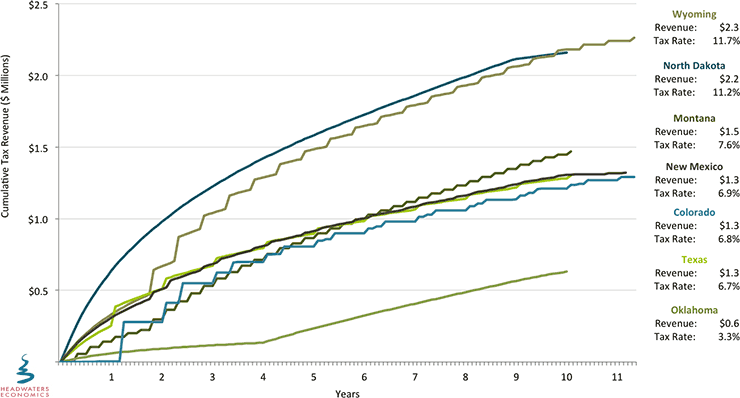
Figure 2. Comparison of Distribution of Production Tax Revenue from a Typical Unconventional Oil Well
Background
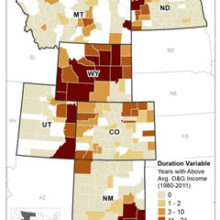
Unconventional oil is extracted from tight shale formations using horizontal drilling and hydraulic fracturing technologies. The focus on unconventional oil is important as horizontal drilling and hydraulic fracturing technologies have led a resurgence in oil production in the U.S. Unconventional oil plays require more wells to be drilled on a continuous basis to maintain production than comparable conventional oil fields. This expands potential employment, income, and tax benefits, but also heightens and extends impacts on communities and public costs.
State and local governments levy different types of production taxes, at different rates, and offer a complex array of exemptions, deductions, and incentives. The various approaches to taxing oil and natural gas make comparisons between states difficult, although not impossible. This report applies each state’s fiscal policy, including production taxes and revenue distributions, to a typical new unconventional oil well over ten years of production. This allows for a comparison of how states tax oil extracted using unconventional technologies, and how this revenue is distributed to communities over time.
To provide a simple framework for the comparison, we assess state production tax policies on four criteria: the amount, time, location, and predictability of revenue distributions to local governments where extraction and associated impacts occur.
The various approaches to taxing oil make comparisons between states difficult, although not impossible. To compare states, we apply each state’s fiscal policy, including production taxes and revenue distributions, to a typical unconventional oil well. This allows for a comparison of how states tax oil extracted using unconventional technologies, and how this revenue is distributed to communities.
We hope these data and resources will be useful to states and communities with unconventional oil development that are trying to mitigate the short-term impacts of oil extraction while making investments in long-term economic development opportunities.