• Skip to primary navigation
  • Skip to main content
  • Skip to footer
Headwaters Economics

Headwaters Economics

Independent Nonpartisan Research

  • Research
    • Economic Development
    • Equity
    • Natural Hazards
    • Public Lands
    • Outdoor Recreation
    • Tax Policy
  • Tools
  • About Us
  • Search

Annual Report

February 2020

The Headwaters Economics team at work.

Headwaters Economics’ interactive Impact Report highlights its 2019 research, community partners, presentations and reports, news articles and press.

Recreation Counties Across the U.S.

June 2019

Tableau Viz showing recreation counties in the U.S.

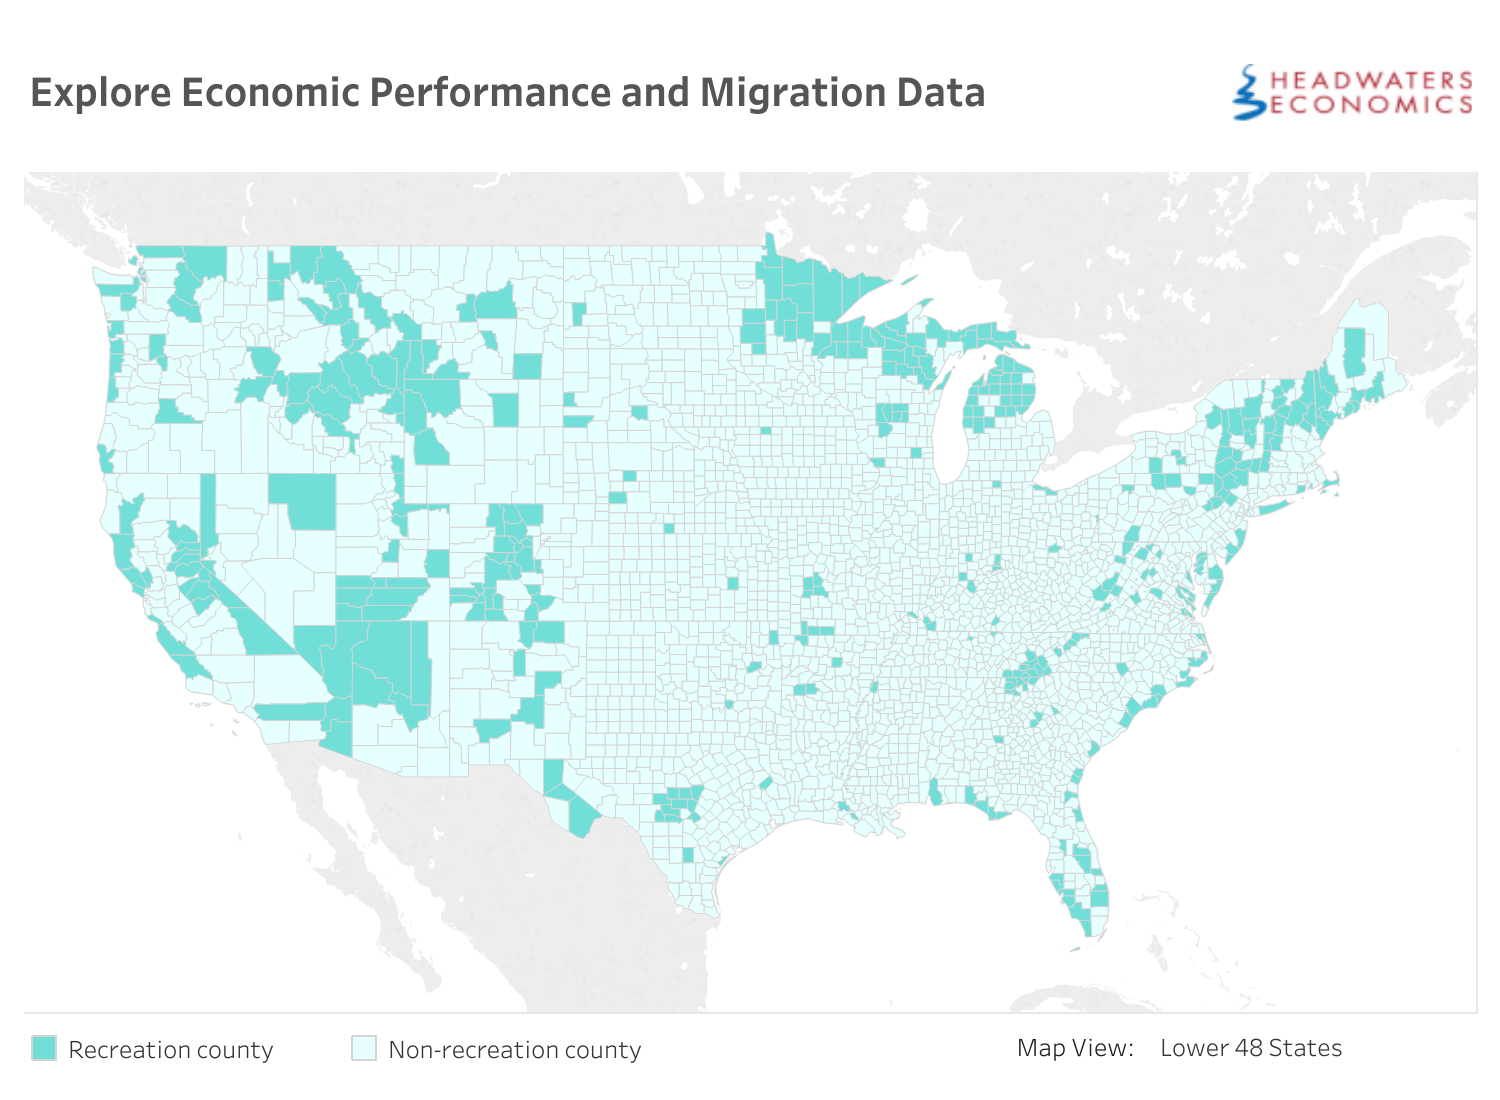
Explore economic performance in Recreation Counties across the U.S.

National Forest Gross Receipts from Commercial Activities, FY 1986-2017

March 2019

Explore and Download National Forest Gross Receipts Statistics

National Forest Timber Sales and Timber Cuts, FY 1980-2018

March 2019

Timber Cut and Sold map

Explore and Download National Forest Cut & Sold Report Statistics

National Parks Economic Impacts

May 2018

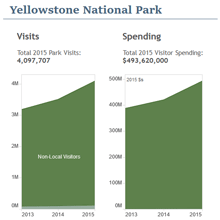
Explore National Parks economic impacts from estimated visits, jobs, and labor income created by visitor spending in National Park Service lands.
Updated August 2019 with latest available data.

National Forest Socioeconomic Indicators

May 2018

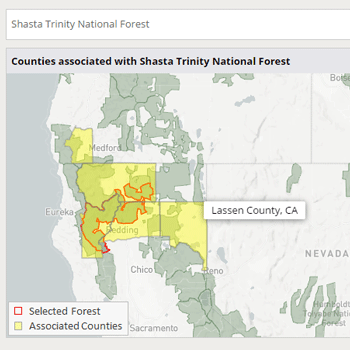
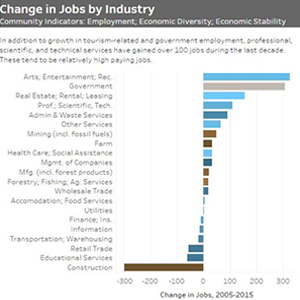
Explore the socioeconomic conditions in communities surrounding our National Forests

Communities Threatened by Wildfire, 2000-2017

April 2018

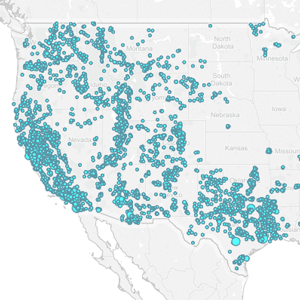
The interactive map identifies frequently threatened towns and cities, including the different sizes and distances of wildfires from nearby communities.

West-Wide Economic Atlas

November 2017

West Wide Atlas Map and Charts

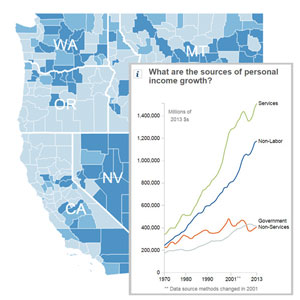
Explore socioeconomic and land use trends in the western eleven states.
Updated July 2019 with latest available population, economic, and land ownership data.

National Monuments: Economic Performance Before and After Designation

June 2017

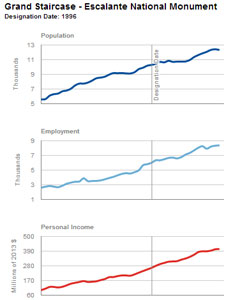
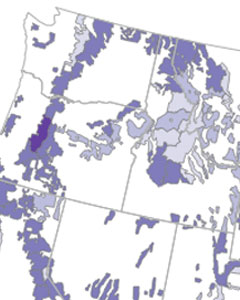
Assess the UPDATED trends and performance of four key economic indicators in communities adjacent to national monuments: population, employment, personal income, and per capita income.

Federal Lands in the Rural West: Liability or Asset?

February 2017

federal lands data visualization

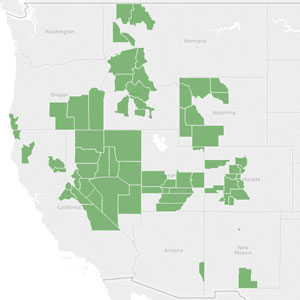
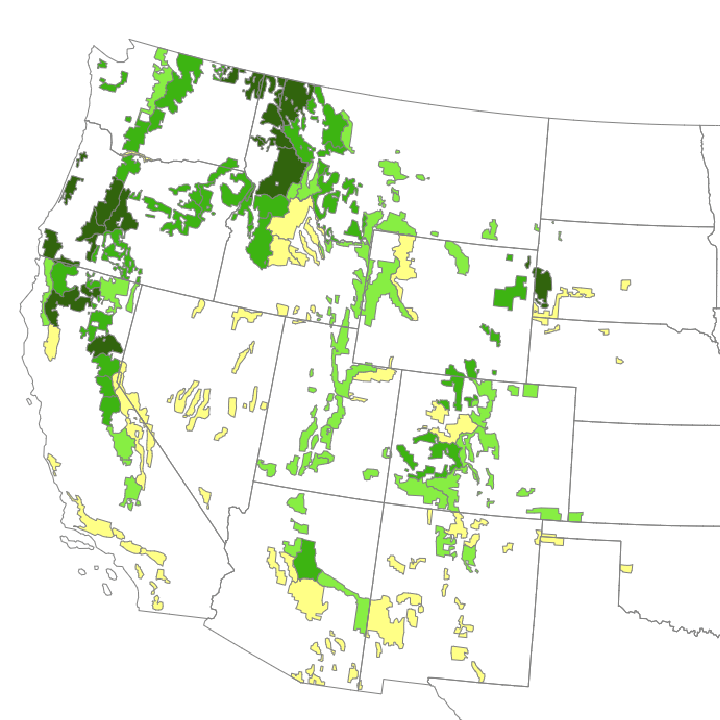
Rural counties in the West with more federal lands performed better on average than their peers with less federal lands in four key economic measures. Explore the trends and exceptions across the rural West.

Measuring Prosperity in Gunnison County, Colorado

February 2017

This tool explores socioeconomic trends in Gunnison County, Colorado and compares them to neighboring counties and the state of Colorado.

What Do Local Governments Receive from Oil and Gas Production Taxes?

December 2016

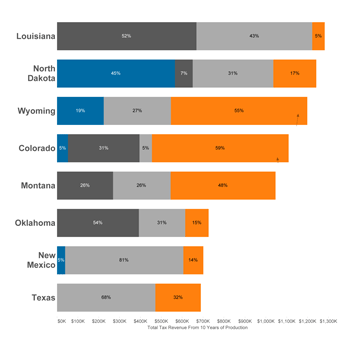
Compare the effectiveness of states’ oil and natural gas tax policies to see which states ensure that tax revenue is available in the right amount, time, and location to manage drilling-related increases in the local demand for services. See which states invest in long-term infrastructure and economic diversification.

Trail and Pathway Use in Jackson Hole, Wyoming

June 2016

Explore seasonal use—including the amount, type, and timing—for 25 regional trails and pathways

County Payments: History, Context, and Policy

February 2016

county payments map

These interactive maps show how federal land payments are distributed to counties and states. Explore both the Payments History maps as well as the Policy Options maps which project what happens if SRS is not reauthorized or if PILT is reformed into a single payment to counties.

Federal Lands Performance: Sortable Table by County

February 2016

Click the column headers in the data table below to change the sort order.

Three Wests

October 2015

featured-image-dataviz-three-wests

Research shows there are three distinctly different types of counties in the West, defined by their access to major markets and population centers.

Land & Water Conservation Fund, 2011 – 2014

July 2015

lwcf dataviz map

Explore benefits of Land and Water Conservation Fund projects.

Socioeconomics and Climate Change in the Great Lakes Region

March 2015

This interactive shows how the social and economic characteristics of the Great Lakes Region are impacted by regionally specific changes in climate. It was developed in partnership with the Great Lakes Adaptation Assessment for Cities at the University of Michigan.

Migration & Population Trends in the West Vary by County Type

December 2014

Explore the four county types and their migration and natural population change (births and deaths).

Across the West, Non-Labor Income Is Large and Growing

February 2014

Among western counties, non-labor income makes up 41 percent of total personal income and is growing, representing 60 percent of net personal income growth in the last decade. Comprised of three main types—investments, age related, and hardship payments— non-labor income is affected by the stock market, retiring Baby Boomers, and changes to Medicare, Medicaid, and Social Security.

  • Go to page 1
  • Go to page 2
  • Go to Next Page »

Footer

Independent Nonpartisan Research

Contact

© 2021 Headwaters Economics, all rights reserved

  • Sitemap
  • Terms of Use
  • Photo Credits
  • Media Coverage
  • Slides
  • Contact
  • Twitter