-
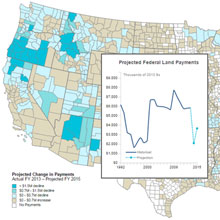
These interactive maps show how federal land payments are distributed to counties and states. Explore both the Payments History maps as well as the Policy Options maps which project what happens if SRS is not reauthorized or if PILT is reformed into a single payment to counties. Read more
-
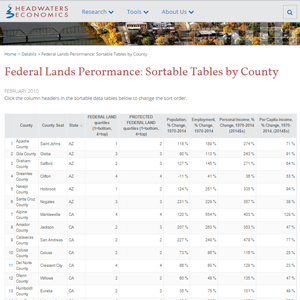
Click the column headers in the data table below to change the sort order. Read more
-
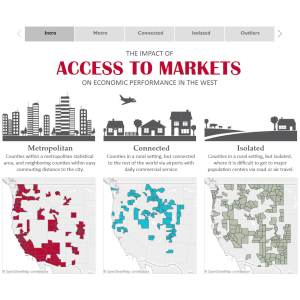
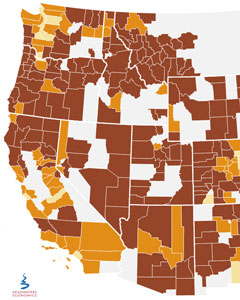
Research shows there are three distinctly different types of counties in the West, defined by their access to major markets and population centers. Read more
-
Explore benefits of Land and Water Conservation Fund projects. Read more
-
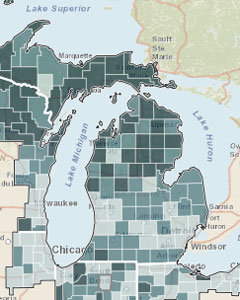
This interactive shows how the social and economic characteristics of the Great Lakes Region are impacted by regionally specific changes in climate. It was developed in partnership with the Great Lakes Adaptation Assessment for Cities at the University of Michigan. Read more
-
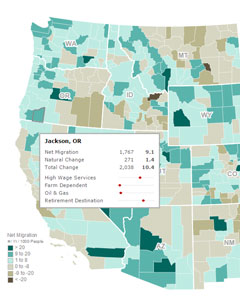
Explore the four county types and their migration and natural population change (births and deaths). Read more
-
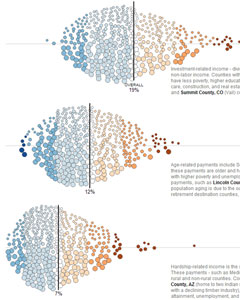
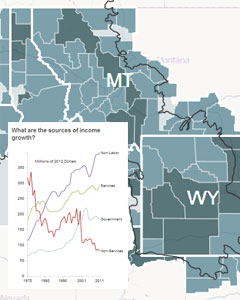
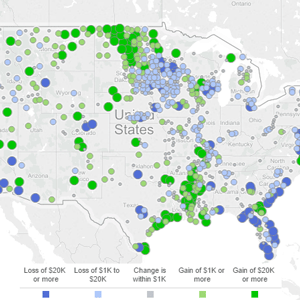
Among western counties, non-labor income makes up 41 percent of total personal income and is growing, representing 60 percent of net personal income growth in the last decade. Comprised of three main types—investments, age related, and hardship payments— non-labor income is affected by the stock market, retiring Baby Boomers, and changes to Medicare, Medicaid, and… Read more
-
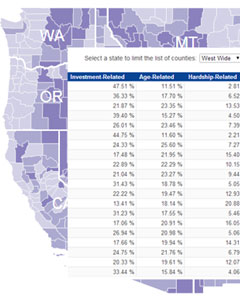
Across the West, non-labor income is a large and growing source of personal income. This sortable county-level interactive allows users to review the importance of three largest sources of non-labor income: investments, age related, and hardship payments. Read more
-
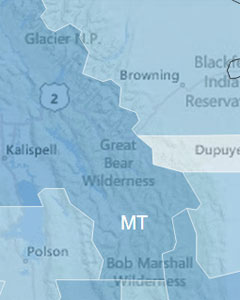
This interactive website was created to help inform conservation goals and actions with knowledge of the geography and people in this unique region. Read more
-
This interactive website was created to help inform conservation goals and actions with knowledge of the geography and people in this unique region. Visit the Great Northern Landscape Conservation Cooperative website for more information. Read more
-
Fighting wildfires costs have averaged more than $3 billion per year, and home protection contributes substantially to this amount. The majority of the WUI in the West is currently undeveloped, but building on these lands will significantly drive up costs. Read more
-
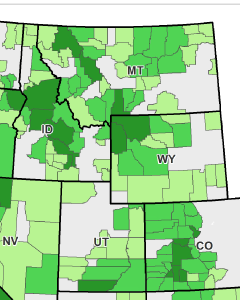
New Study, Interactive Map Show the Amount of Per Capita Income (PCI) Explained by Protected Land Read more
-
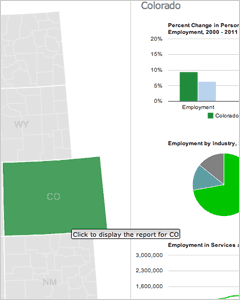
Map-Based Navigation of Employment, Income, and Industry Charts for the Eleven Western States Read more
-
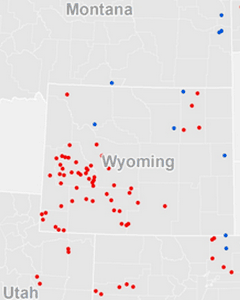
Measuring Total Rig Weeks and Changes in Rig Weeks by County Read more
-
Compare Status Quo Payments to Single PILT Proposal; or USFWS Proposal to Single PILT Read more
-
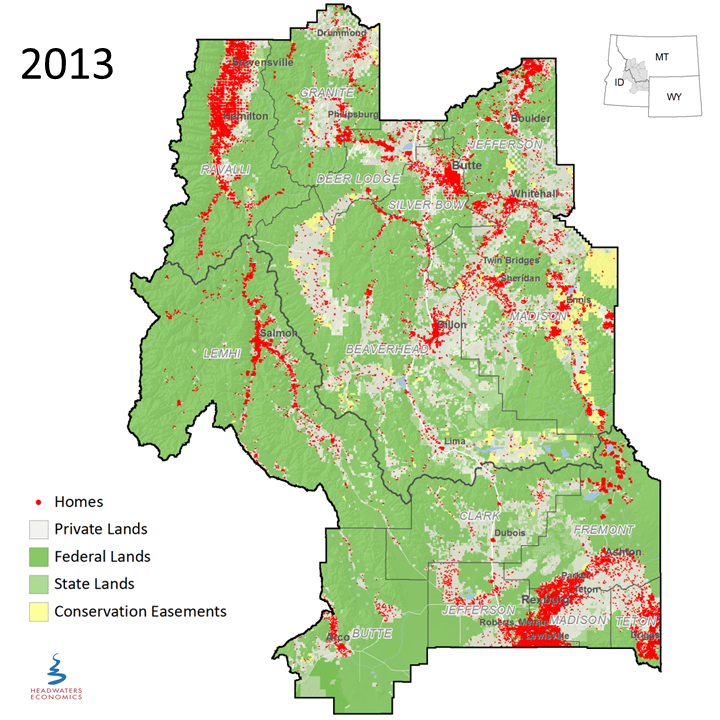
Explore maps showing homes built in the High Divide from 1900 – 2013 plus a 2023 forecast. Read more
-
There is no excerpt because this is a protected post. Read more