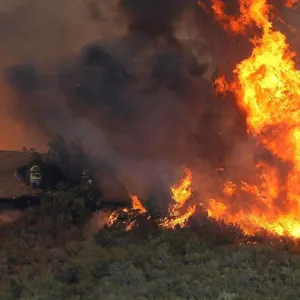
People’s susceptibility to wildfire is based on their exposure to flames and fuel, but also on their ability to prepare for, respond to, and recover from a wildfire. Shortsighted and unjust policies have shaped people’s abilities to cope with disasters, making some populations disproportionately vulnerable. Variables such as income, age, mobility, and other socioeconomic factors can influence vulnerability to wildfire impacts.
For example, the elderly, disabled, and people of color are more likely to have medical conditions exacerbated by wildfire smoke. A lack of transportation or language barriers can complicate evacuation, relocation, and access to aid. Families living in poverty and people living in mobile or manufactured homes may not have the agency and resources to prepare in advance of a wildfire event. Any single characteristic—let alone multiple overlapping characteristics—can result in disproportionate exposure to catastrophic loss.
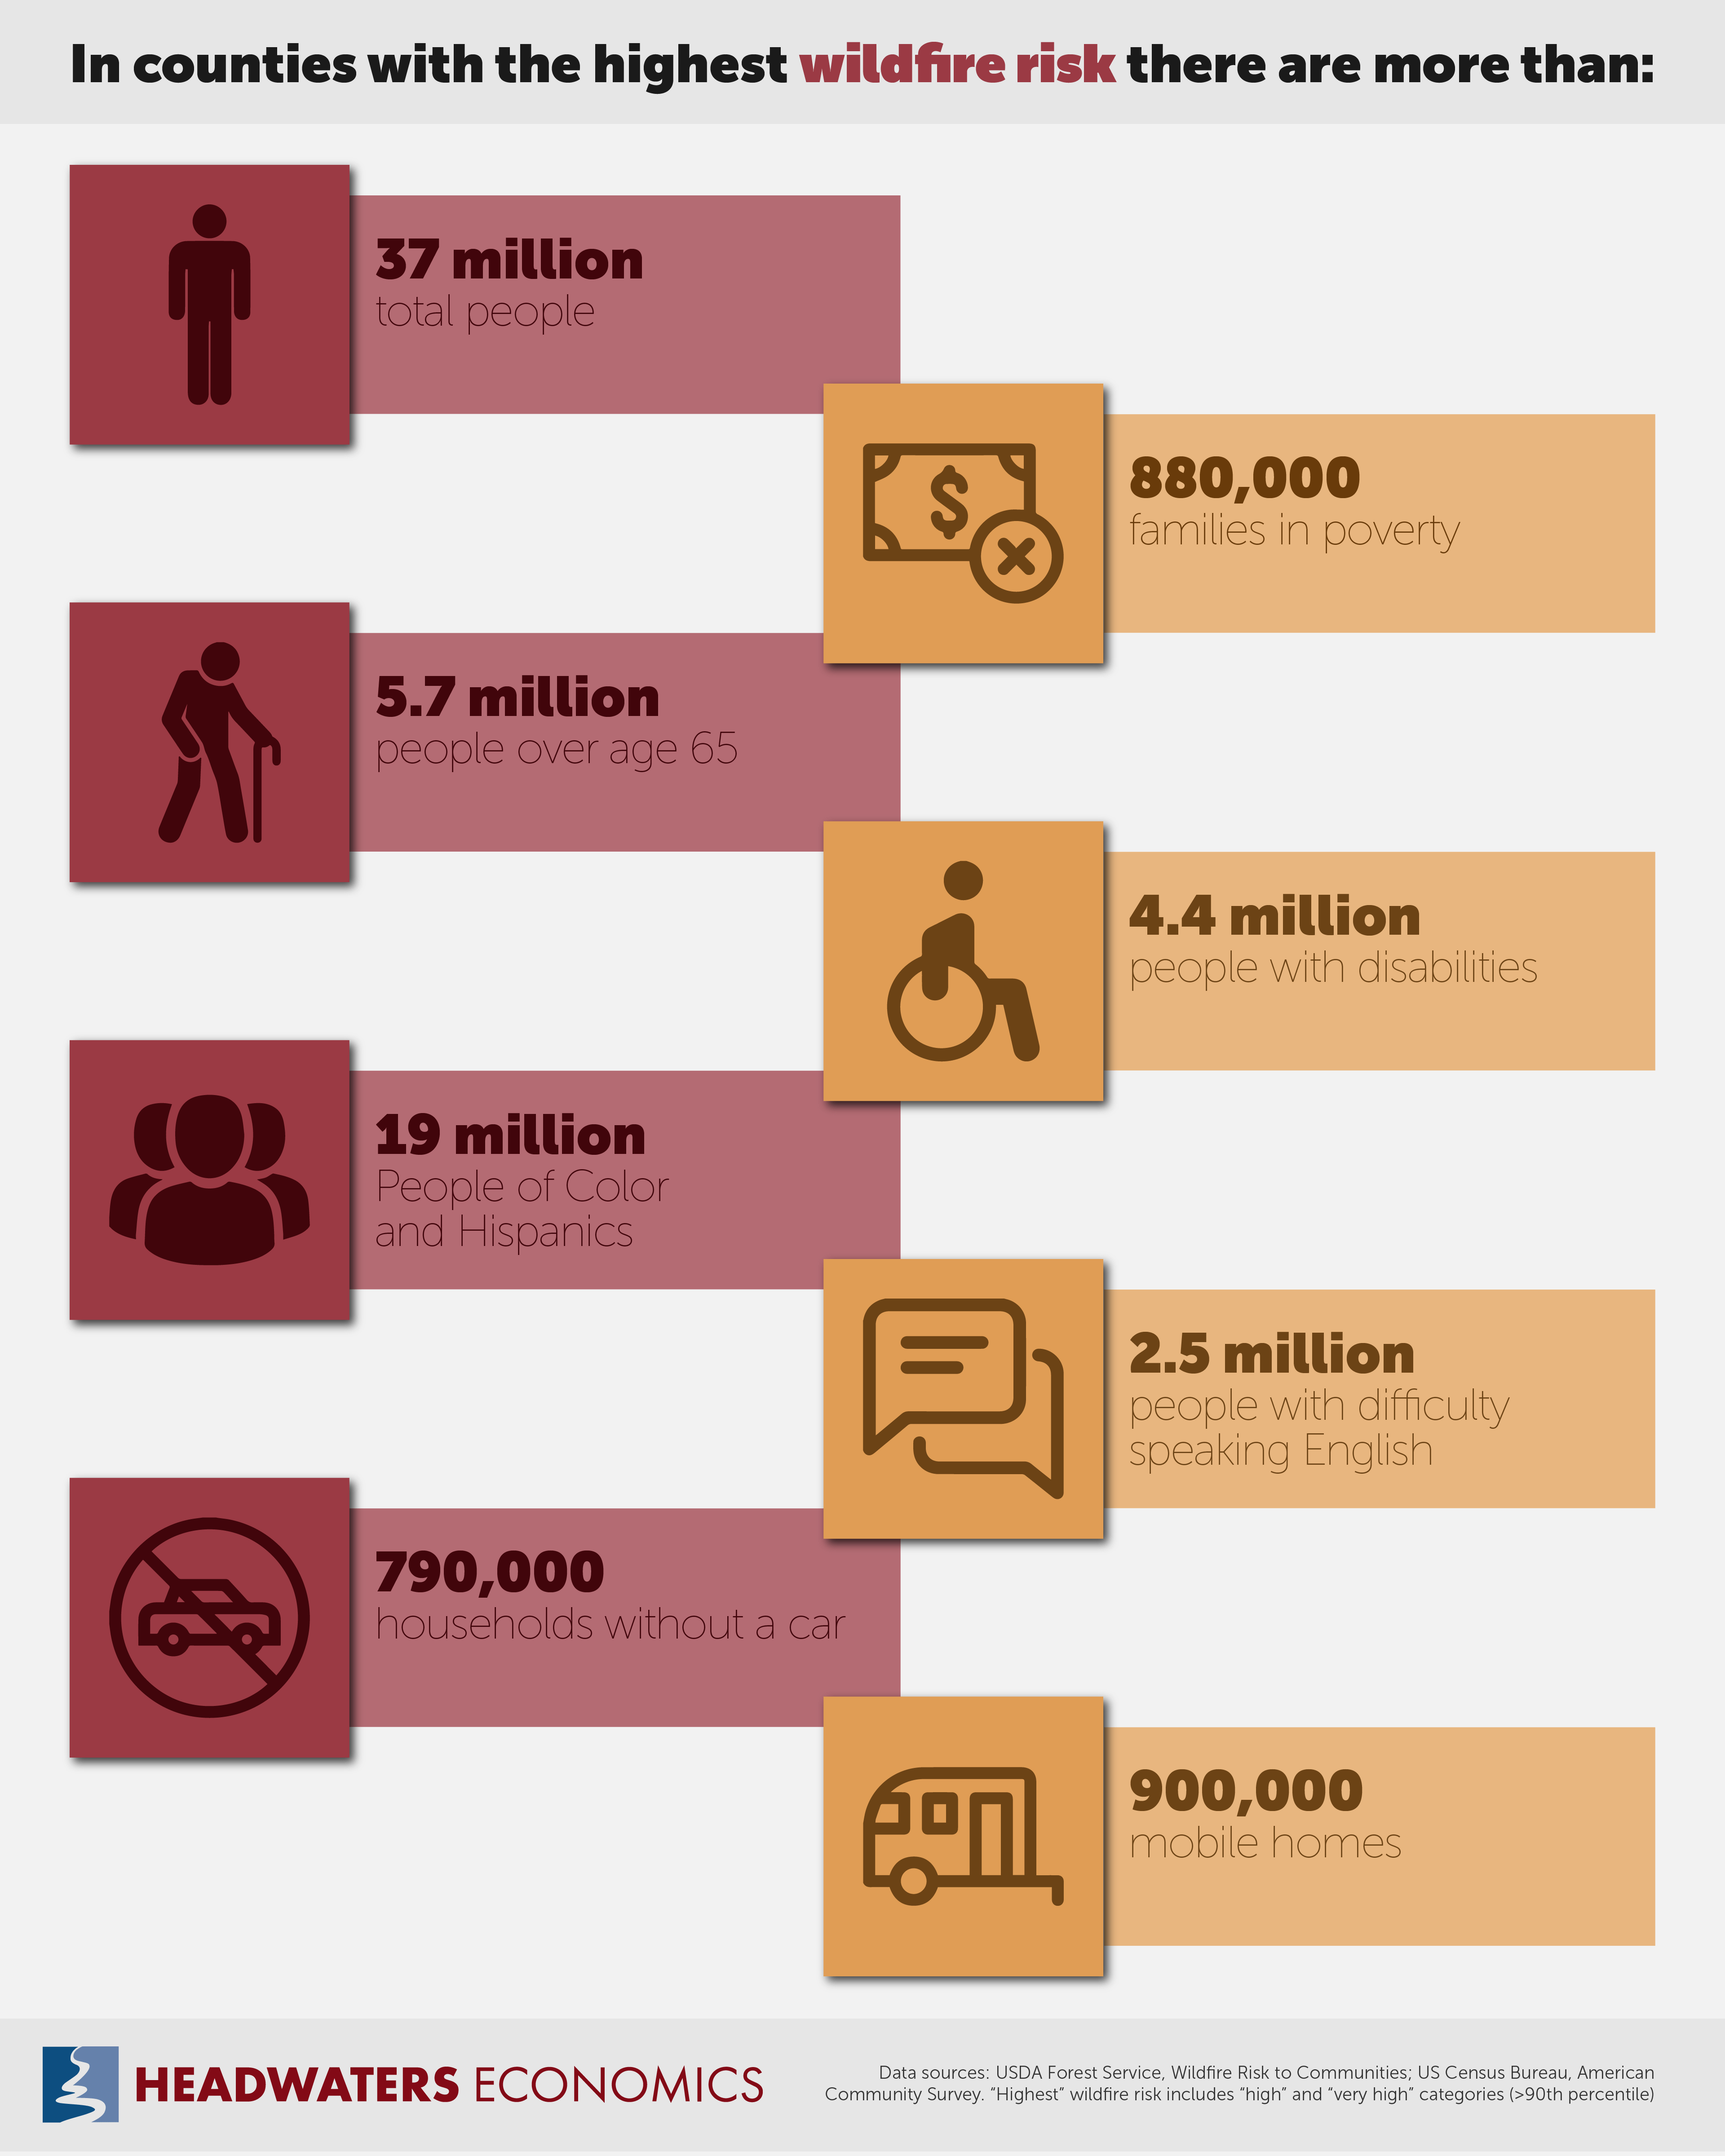
In a new analysis, we find:
Subscribe to our newsletter!
Knowing where wildfire may have disproportionate impacts can help federal, state, and community leaders direct resources for mitigation and adaptation projects, target and customize education and outreach efforts, and tailor operational plans for evacuation, emergency housing, and recovery strategies.
Wildfires are inevitable and will increase in frequency and intensity with a warming climate. Learning to live with wildfire and creating fire-adapted communities is only possible if we anticipate and mitigate its unequal impacts.
The interactive map below lets you filter counties by wildfire risk and demographic characteristics of populations that may be particularly vulnerable to wildfire. A state-level interactive map is also available at the end of this post.
Invest in communities
Investing in communities and directing resources to populations disproportionately impacted by wildfires can help people prepare and adapt to increasing wildfire risks. Community support in the form of subsidies, grants, land use planning, and local partnerships can bolster mitigation efforts and overall resilience. Examples include:
- Provide subsidies to homeowners for mitigation measures (such as creating defensible space within 100’ of the home) and retrofitting homes with ignition-resistant building materials.
- Produce natural hazard information, outreach materials, and evacuation protocols in multiple languages.
- Adopt land use planning regulations for new construction in wildfire-prone areas that limit how, where, and under what conditions homes can be built. After a wildfire, consider integrating resilience strategies into repopulation and rebuilding strategies.
- Anticipate smoke impacts. Develop smoke-ready community awareness campaigns and establish accessible clean-air shelters.
- Rely on local knowledge to build trust among different resident groups and the institutions seeking to build community resilience.
- Integrate diverse knowledge from communities themselves about land management and fire preparedness, including Indigenous knowledge of land stewardship, fire regimes, and fire management.
- Build partnerships with community institutions and support community-centered efforts to identify sources of vulnerability.
Subscribe to our newsletter!
Populations potentially vulnerable to wildfire
The capacity to cope with disasters is largely rooted in social, economic, and political structures from which some populations may be marginalized or systematically excluded, resulting in unequal impacts from wildfire.
People over age 65
Older populations are more likely to have pre-existing medical conditions or compromised mobility, which can reduce their ability to respond to wildfire. Older adults are more susceptible to air pollution and particulates associated with wildfire smoke.

People with disabilities
People with disabilities are subject to health complications that make wildfire more consequential since disasters often result in limited access to medical care. Compromised mobility and medical conditions can reduce the ability to evacuate and relocate during a wildfire.

People with difficulty speaking English
Language barriers make it more difficult to follow directions or interact with agencies before, during, or after a wildfire disaster. A person’s ability to act during an emergency can be compromised by language and cultural barriers.
Households without access to a car
During emergencies, people who do not have a car are less likely to evacuate or have access to emergency response centers. Access to a car is also linked with higher wages and more financial stability.

Families in poverty
Low income is one of the strongest predictors for compromised health and ability to recover from disasters. Wildfires disproportionately affect people with low incomes because of factors such as inadequate housing, social exclusion, a diminished ability to evacuate or relocate, and more acute emotional stress. These populations are also more likely to be overlooked during emergency response following disasters and are less likely to have adequate property insurance, so they bear a greater burden from property damage following wildfires. Because of a lack of financial resources and time, families with lower incomes may be less likely to take proactive measures to mitigate wildfire hazard in advance of an event.

People of Color and Hispanics
Race and ethnicity are strongly correlated with disparities in health and vulnerability to natural hazards and with access to aid and resources, including wildfires. Black, Indigenous, Hispanic, and other People of Color tend to be particularly vulnerable to disasters due in part to cultural and institutional barriers. Race and wealth are linked with health conditions like asthma that can be exacerbated by wildfire smoke and environmental stress and with access to aid and resources after a wildfire event. Indian reservations in remote, rural areas often have higher wildfire hazard potential combined with higher rates of poverty, disabilities, and mobile home housing, making Native Americans particularly vulnerable to wildfire disasters.

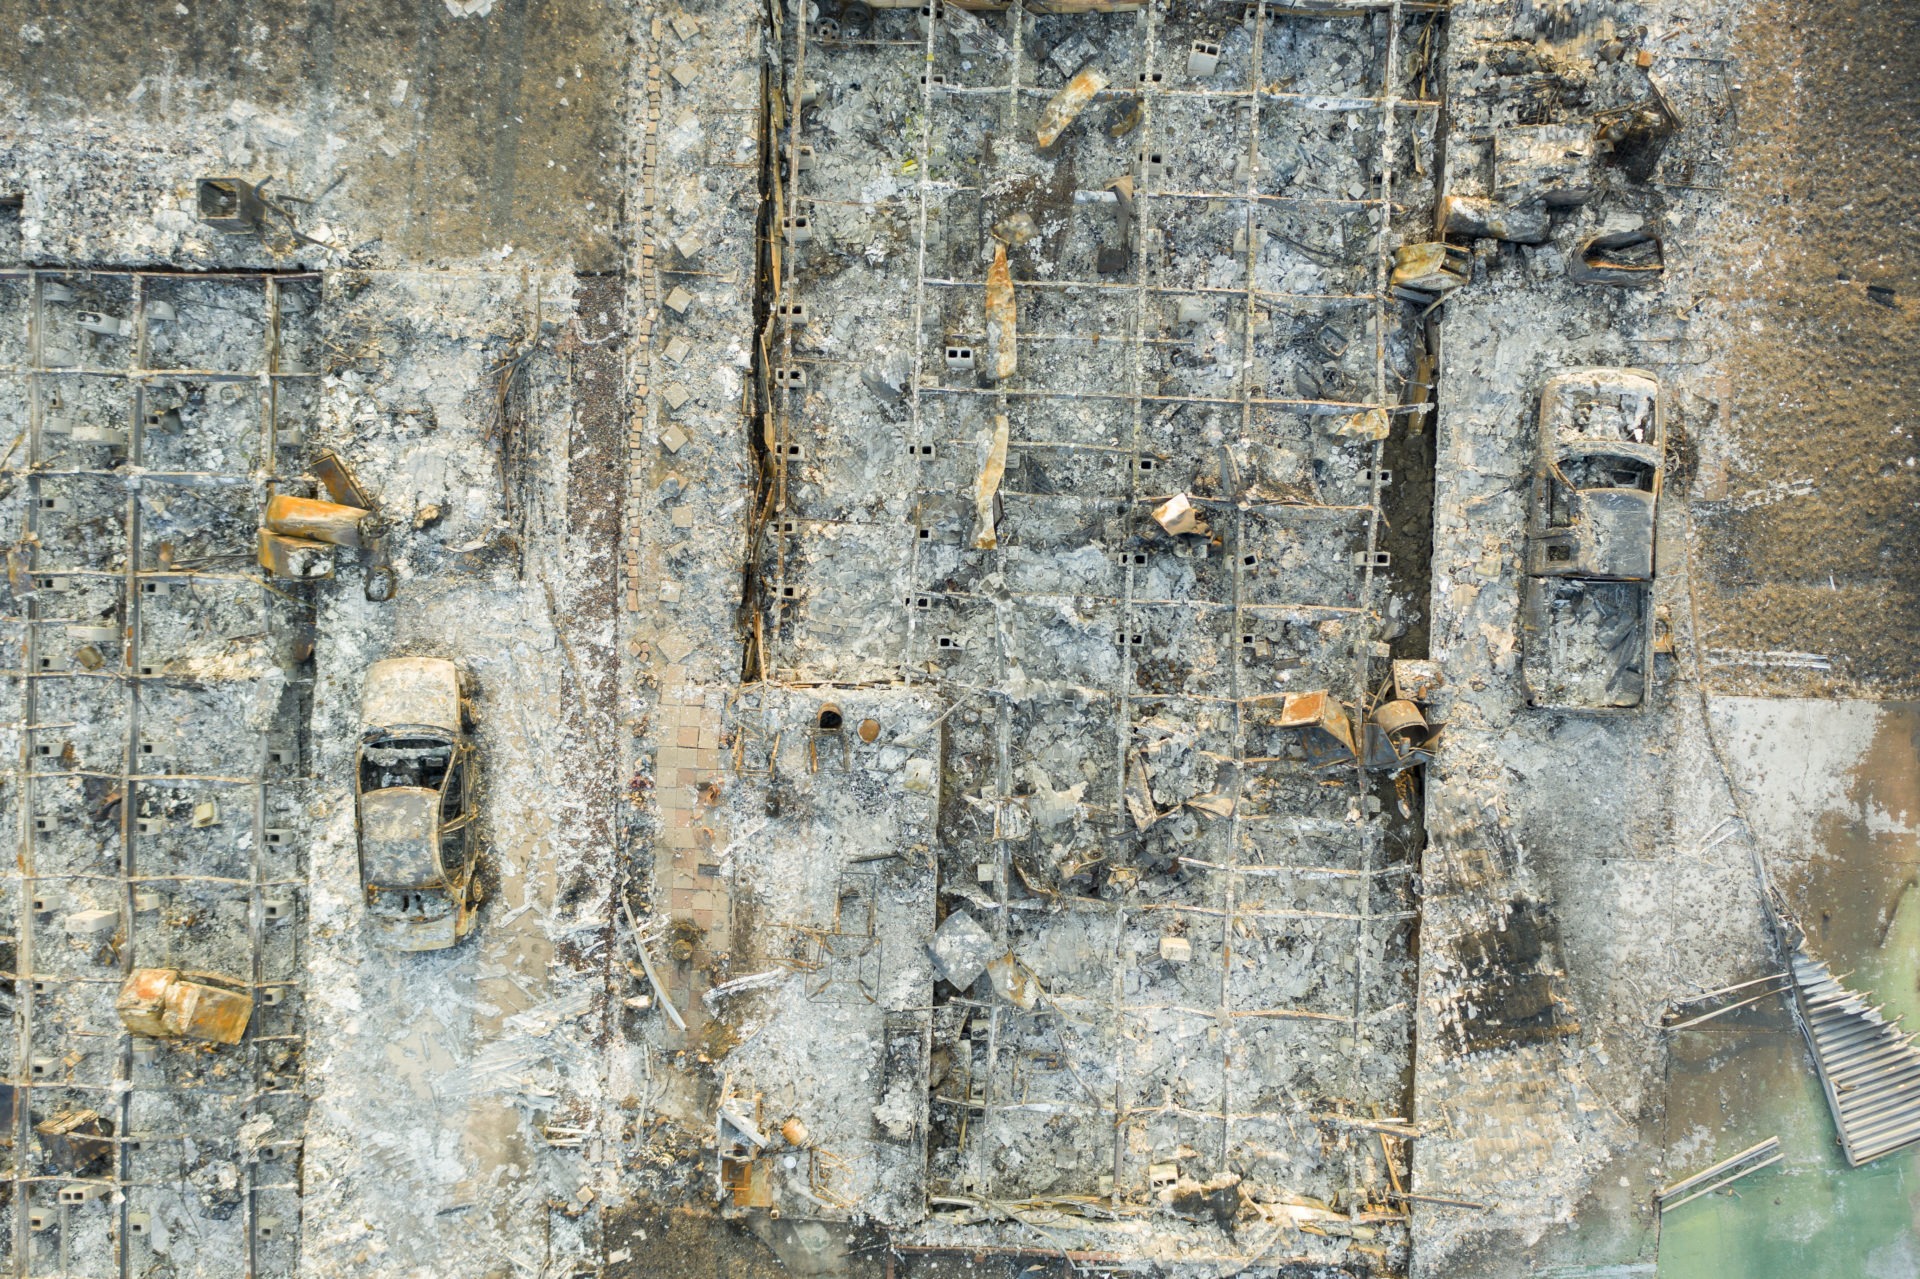
Mobile homes
Mobile and and manufactured homes house an estimated 2.7 million U.S. households and create both physical and economic risk. Mobile and manufactured homes are more likely to be damaged during disasters and fires spread faster in mobile and manufactured homes, posing a risk both to the structure and the occupants. Mobile and manufactured home residents are more likely to have low incomes, be elderly, and have low English proficiency. Most mobile and manufactured home owners do not own the land where their residence sits, giving them less agency to invest in property mitigation such as the creation of defensible space. Research has found mobile and manufactured home owners experience barriers to accessing aid after disasters.
Data sources & methods
Wildfire risk data
Wildfire risk is based on the metric “Risk to Homes” (also called “Risk to Potential Structures”) from Wildfire Risk to Communities, a project of the USDA Forest Service Washington Office of Fire and Aviation Management created in partnership with USDA Forest Service Rocky Mountain Research Station’s Missoula Fire Sciences Laboratory, Pyrologix, and Headwaters Economics.
On the U.S. map, wildfire risk is shown relative to the entire nation. On the state maps, wildfire risk is shown relative to the selected state. On all maps, wildfire risk is binned into five classes, as per guidelines in the publication accompanying the dataset:
- Low: 0 to 40th percentile
- Medium: 40th to 70th percentile
- Medium-High: 70th to 90th percentile
- High: 90th to 95th percentile
- Very High: 95th to 100th percentile
Socioeconomic data
The seven socioeconomic variables are from U.S. Census Bureau’s American Community Survey (ACS). Data are from the latest release of the ACS five-year estimates (2015-2019). The 5-year estimates from the ACS are “period” estimates that represent data collected over a period of time. The primary advantage of using multiyear estimates is the increased statistical reliability of the data for less populated areas and small population subgroups.
The American Community Survey is a survey of residents, so has a margin of error based on the number of respondents. The margin of error is reported in the mouse-over tooltip for each county.
The variable “People of Color and Hispanics” is the difference between the Total Population estimate and the estimate for Non-Hispanic people that also identified as White alone.
How to cite this research
The unequal impacts of wildfire. 2021. Headwaters Economics. Bozeman, MT.
Acknowledgments
We would like to thank Thierry D’Hers and the Tableau Foundation for support in the creation of this data visualization.