Headwaters Economics has conducted an analysis of flood and socioeconomic data to illustrate where flood risks disproportionality affect vulnerable populations.
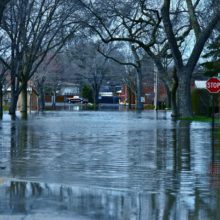
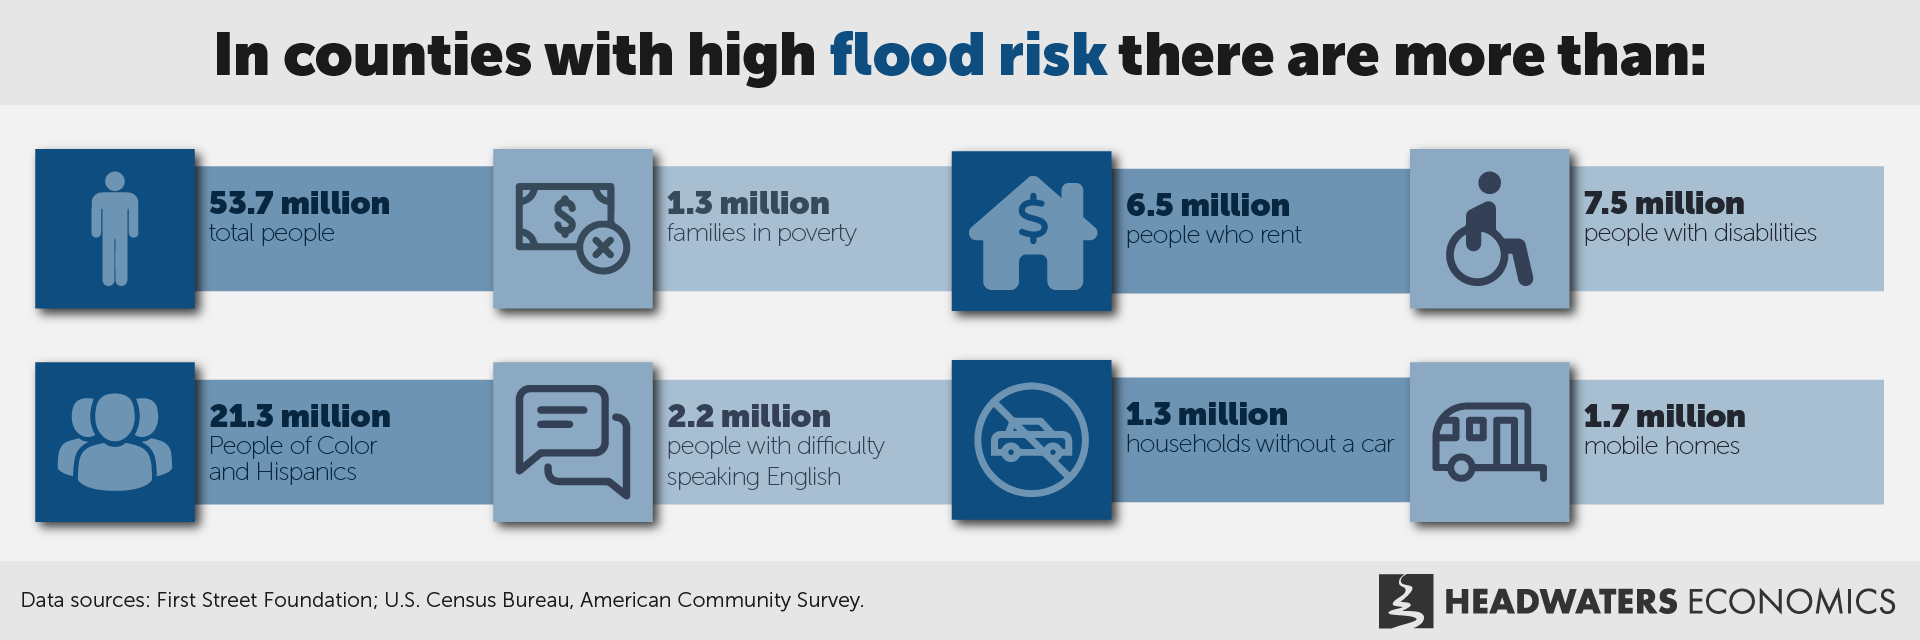
Floods both expose and reinforce inequities. Over 53 million people in the United States live in high flood risk areas, but certain groups – such as people of color and Hispanics, mobile home residents, and people with disabilities – are more likely to be impacted by a flood than others.
A community’s vulnerability to flooding is based on its exposure to rising water, its infrastructure, local government capacity, and people’s ability to prepare for, respond to, and recover from a flood event – often referred to as social vulnerability.
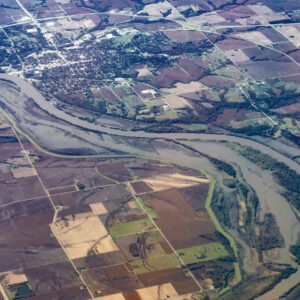
Socially vulnerable groups tend to have more exposure to flooding and be disproportionately impacted in the short and long terms.
In a new analysis, we find:
The unequal impacts of flooding are well documented, yet hard to change. Historic economic, political, and land use decisions have led to certain groups facing higher risk while also having less ability to access resources and less power to advocate for changes. Compounding these vulnerabilities, disaster recovery systems in the United States have been shown to further reinforce patterns of inequities and unequal access to resources.
Subscribe to our newsletter!
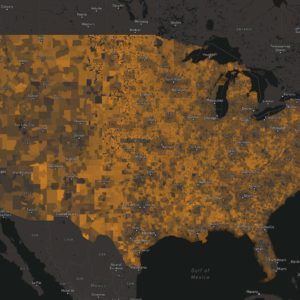
Headwaters Economics has conducted an analysis of flood and socioeconomic data to illustrate where flood risks disproportionality affect vulnerable populations, especially in lower-capacity communities where local governments face challenges in planning and executing disaster mitigation projects. In the interactive map below, one can filter counties by flood risk, community capacity, and demographic characteristics of populations that may be particularly vulnerable to floods. This tool can help identify places that need more resources, technical assistance, and long-term investments to address flood risk and protect community members.
Populations potentially vulnerable to flooding
Social, economic, and political systems shape a community’s capacity to cope with disasters. In many cases these structures have marginalized or even excluded some populations from initiatives to prepare for, or respond to, destructive floods.

Families in poverty
Floods disproportionately impact people with lower incomes and families in poverty who may have inadequate housing, live in high-risk areas, and have fewer resources. People who struggle financially prior to the disaster often experience the worst short- and long-term financial impacts from floods, including harm to credit scores, increases in debt, and increased likelihood of defaulting on mortgages or declaring bankruptcy. Disasters have also been shown to increase wealth inequality over time, exacerbating income and wealth inequalities within the community.

People of Color and Hispanics
Race and ethnicity often correlate to higher vulnerability and exposure to flooding. In many locations, this is an outcome of unjust land use decisions such as redlining and racial covenants. Exposure to flooding is often further compounded by other vulnerabilities, from living in neighborhoods with inadequate infrastructure to higher exposure to legacy industrial pollution. Federal disaster recovery aid has also been shown to disproportionately benefit white people, leaving Black, Indigenous, Hispanic, and other people of color behind.

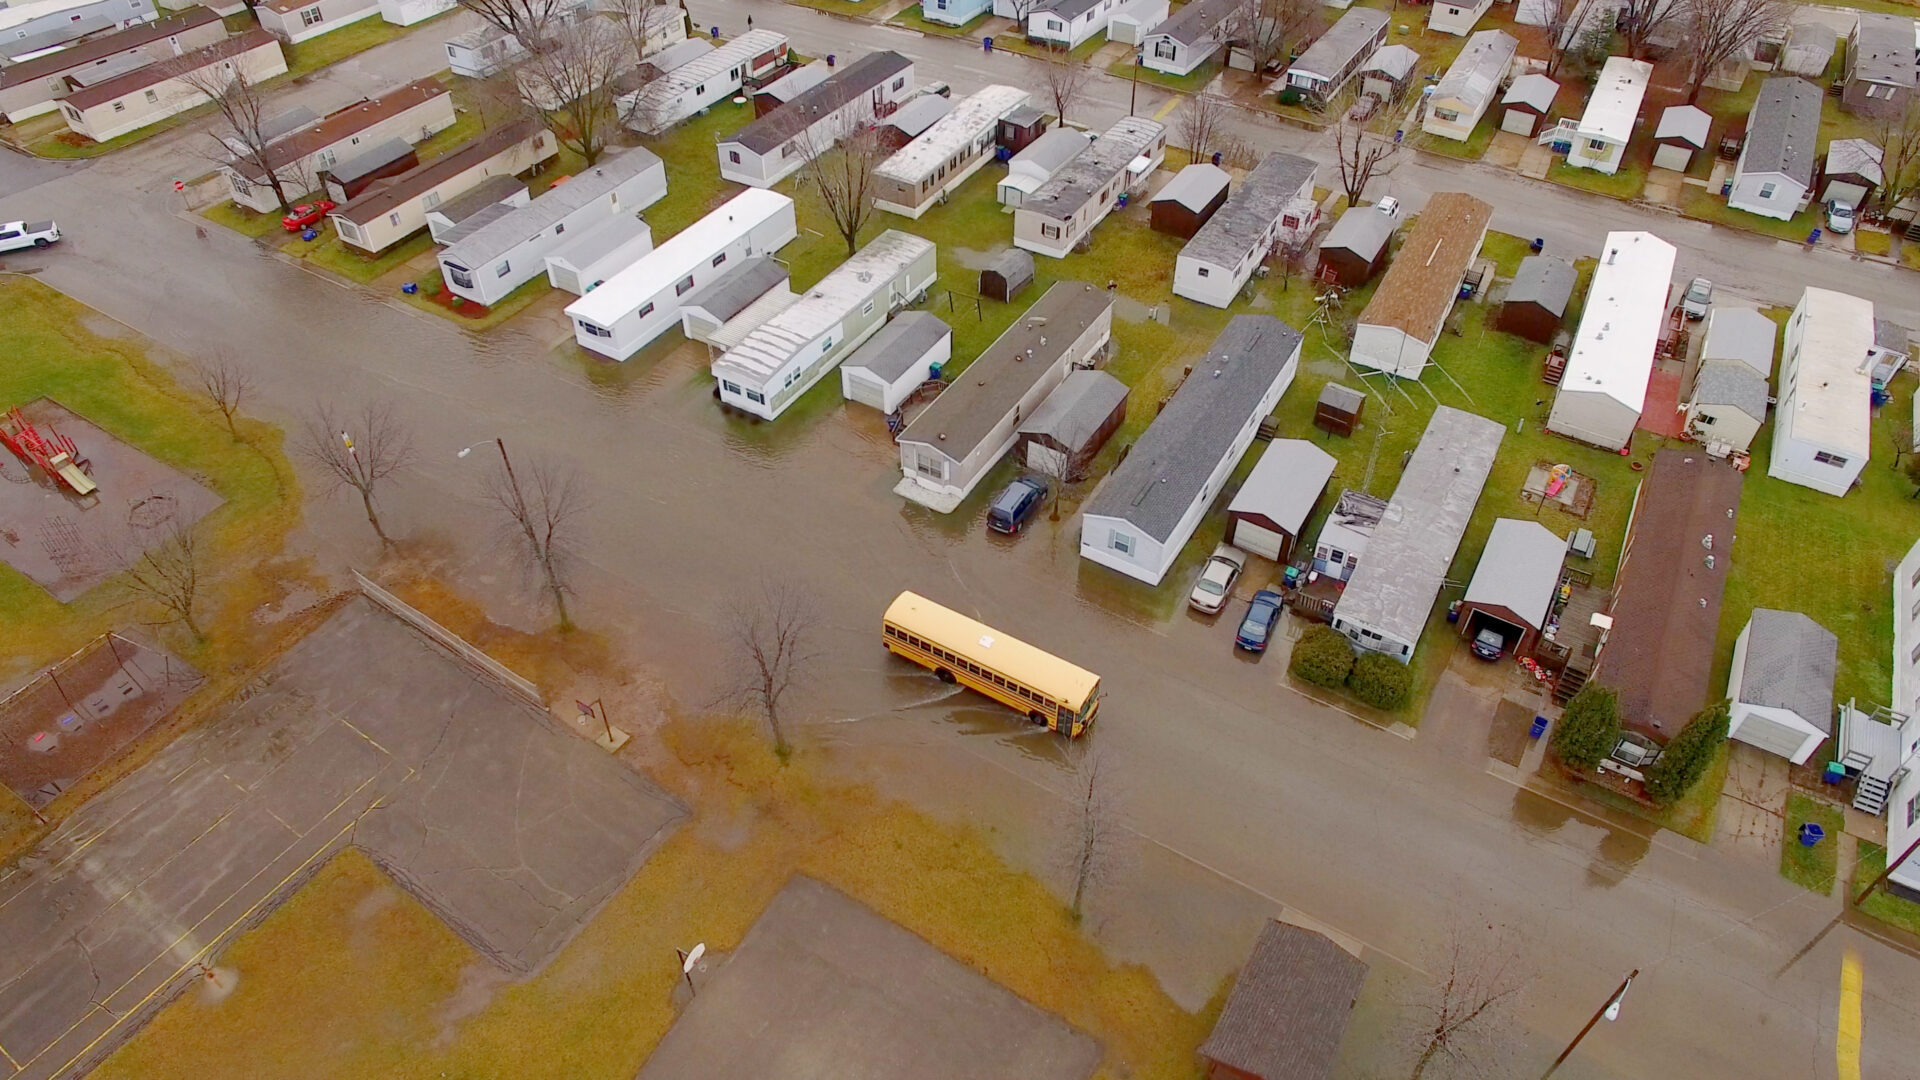
Mobile home residents
An estimated 22 million people live in mobile and manufactured homes in the United States. Residents of these homes face a disproportionately higher risk of flooding than residents in other housing types. Mobile home residents also have socioeconomic characteristics that make them vulnerable to floods, including higher rates of poverty, a greater likelihood of disability or mobility issues, a greater likelihood to be seniors or families with small children, and a greater likelihood to be immigrants or have English as a second language.

Renters
Renters have characteristics that make them more vulnerable to disasters, such as having less savings and fewer financial resources, lower levels of housing security, and lower incomes. Renters can receive FEMA aid to cover lost personal property, but they cannot receive funds to repair their homes, making their long-term recovery dependent on landlords. Rental units are more likely to be damaged in a flood event and take the longest time to be repaired afterward. Once repaired, landlords often raise rents, which can lead to new rounds of displacement of renters in the months or years after a flood.

People with disabilities
People with disabilities are more like to be injured or even die during a disaster. Yet, emergency and evacuation plans rarely address their needs, and shelters may not provide necessary accommodations and services. People with disabilities may also face barriers or need extra assistance to access recovery resources due to mobility, communication, and health challenges. Elderly people with disabilities, pre-existing medical conditions, and mobility issues often experience difficulties with evacuating and may also experience barriers to accessing recovery resources.

People with difficulty speaking English
A person’s ability to act during a flood or apply for disaster recovery aid can be compromised by language and cultural barriers. Recent immigrants and/or undocumented workers are more likely to live in areas with high flood risk and inadequate infrastructure. They may also distrust government agencies, preventing them from accessing critical resources for preparing for, responding to, or recovering from a flood.

People without access to a car
During floods and hurricanes, people who do not have a car are less likely to evacuate or have access to emergency response centers. This can threaten safety during a flood and also have unexpected long-term impacts. For example, during Hurricane Katrina in New Orleans, those who did not have access to a car and relied on buses and FEMA airlifts to evacuate had a more challenging time returning after the storm ended and the flooding receded.
Too many local governments lack the staff and resources they need
Local governments are largely responsible for investing in and maintaining projects to decrease flood risk, but not every community has the time, staff, and resources needed to proactively plan and implement projects that can decrease flood risk. Analyses of federal funding for mitigation projects demonstrate that lower-capacity communities are less likely to access climate resilience funding.
Land use, infrastructure, and other government decisions impact flood risk, such as the amount of impervious surface and deferred maintenance on stormwater and wastewater systems. Unincorporated communities and other places that lack local government resources face additional complications to disaster management and emergency response.
State policies and government capacity also shape local communities’ ability to plan for, respond to, and recover from flooding. However, state flood resilience policies vary, including the extent to which they focus on equity and social vulnerability.
FloodWise Community Assistance
Our FloodWise Community Assistance program provides communities with strategic planning assistance, capacity building, and customized research that helps decrease flood risk.
How to address the unequal impacts of flooding
Disaster policies too often fail to account for the impacts faced by vulnerable populations, but there are positive steps that can be taken at the federal, state, and community levels.
Prioritize people and wellbeing in disaster policies, rather than property losses. Many disaster policies are focused on property values, damage assessments, and repair costs. As a result, high-income places often receive more attention and resources. Disaster policies and programs that prioritize social vulnerability metrics such as impacts to affordable housing or low-income people would lead to more equitable outcomes.
Limit administrative burdens. Reducing the time and expertise needed to access resources can help create more equitable outcomes. For instance, instead of using the current application process for disaster recovery aide, FEMA could switch to categorical eligibility, which would mean people impacted by disasters would automatically qualify for assistance.
Proactively fund projects that address the root causes of social vulnerability. Addressing flood risk can have complementary benefits for communities. Flood mitigation projects in places that have a history of disinvestment can be designed to also deliver improved water, wastewater, and/or stormwater infrastructure. Investments that build community wealth by addressing flood risk and social inequality are key for building long-term resilience.
Target communities and regions with high flood risk and limited government capacity. Many communities with high flood risk and social vulnerabilities lack the staff, resources, and expertise needed to implement solutions. Federal agencies and technical assistance providers should prioritize working in these regions with a focus on strengthening local government capacity, with particular attention to the potential of regional solutions.
Data sources & methods
Flood risk data
First Street Foundation provided flood data from their Flood Factor platform for use in this research. Flood risk is defined as the percent of properties within each county that have a >1% chance of a flood in a given year. We rank each county’s flood risk relative to the entire nation:
- Very High: > 90th percentile (higher flood risk than 90% of U.S. counties)
- High: > 75th percentile
- Medium: > 50th percentile
- Low: ≤ 50th percentile (lower flood risk than 50% of counties in the U.S.)
Socioeconomic data
The socioeconomic variables are from U.S. Census Bureau’s American Community Survey (ACS). Data are from the latest release of the ACS five-year estimates (2017-2021). These estimates represent data collected over the five-year period. The primary advantage of using multiyear estimates is the increased statistical reliability of the data for less-populated areas and small-population subgroups.
ACS is a survey of residents with reported margins of error based on the number of respondents. The margin of error as reported by ACS is displayed in the mouse-over tooltip for each county.
The variable “People of Color and Hispanics” is the difference between the Total Population estimate and the estimate for “non-Hispanic” people that also self-identified as “White alone.”
Data about community capacity are from Headwaters Economics’ Rural Capacity Map.
How to cite this research
The unequal impacts of flooding. 2023. Headwaters Economics. Bozeman, MT.