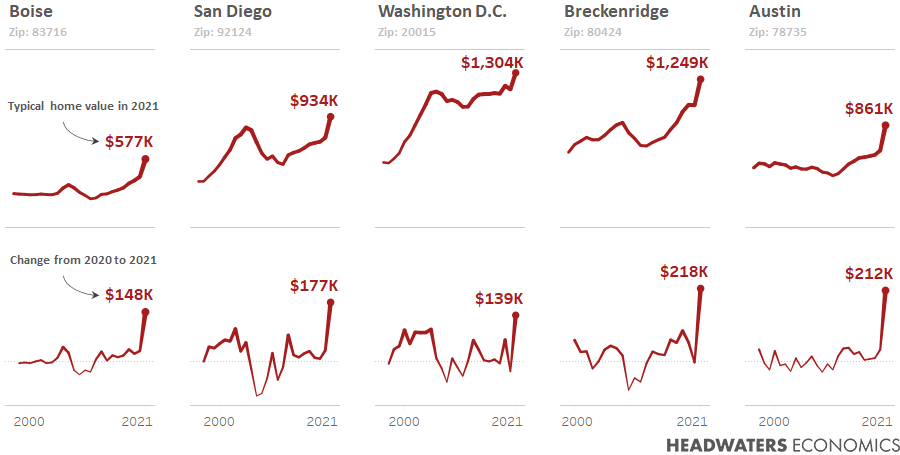
Forty-five percent of Americans (144 million people) are living in places where housing price increases during the pandemic are unprecedented. It is not just tech hubs, mid-sized cities, or resort communities that are managing a housing crisis. This analysis shows that communities across the country, in every state, are grappling with housing prices increasing at a rate that has not been seen before, even during the housing bubble that led to the Great Recession.
In eight states—Colorado, Connecticut, Idaho, Massachusetts, New Hampshire, Oregon, Utah, and Washington—more than half of the zip codes have experienced unprecedented price increases. When price increases are widespread, people have fewer options to relocate affordably nearby.
While unaffordable housing has come to a head during the pandemic, COVID-19 is not solely responsible. Long-term trends in demographics, the labor market, mortgage rates, housing supply, land use policies, and climate-driven disasters have all have contributed to the current crisis.
The unprecedented rise in housing prices since 2020 has affected renters more than homeowners—especially in places that were already unaffordable.
Subscribe to our newsletter!
The impacts of record-setting rises in housing prices reverberate through a community and manifest as labor shortages, increased homelessness, and dramatic increases in rental costs. Those who are priced out of homeownership today will struggle to build wealth for themselves and their children, exacerbating income inequality.
With more people priced out of homeownership, policies and solutions for housing affordability are needed now more than ever. Tools we used previously—like inclusionary zoning and incentives for builders—weren’t keeping up before, and they certainly aren’t now. We need bigger, coordinated investments supported at the local, state, and federal levels. These coordinated efforts need to include the voices of small and large employers and look creatively at housing solutions that include commercial redevelopment and infill.
Data sources and methods
Housing cost data are from the Zillow Home Value Index (ZHVI), which represents the value for a typical single-family home between the 35th and 65th percentile. We compared annual growth rates from 1996 to 2021 in both absolute change (in 2020 dollars) and percent change. Annual growth rates were calculated using typical home values for July each year.


