State-Level Reports
“Phoenix attracts an educated, healthy workforce of 18-34 year olds because of our immediate proximity to diverse outdoor recreation such as mountain biking, hiking, skiing and more. They can live, work and play here. Consequently, companies moving locating to Phoenix enjoy an economic advantage in workforce productivity.”
–Barry Broome, President & CEO, Greater Phoenix Economic Council
Arizona’s economy is growing and outperforming the rest of the country.
This fact sheet summarizes Arizona’s recent economic growth and the role of protected public lands in supporting faster job creation and higher per-capita income. It is part of a larger report — West is Best — that analyzes how and why the West is outperforming the nation, and the competitive advantage offered by its protected lands, which attract talent, investment, and businesses.
Arizona vs Non-Western U.S.,
Percent Change, 2000-2011
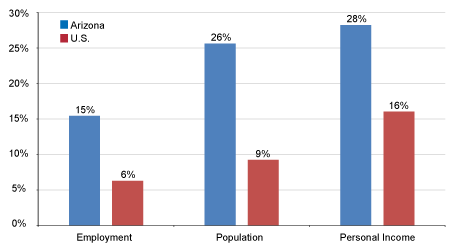
From 2000 to 2011, Arizona’s rate of population, employment, and real personal income growth each outpaced the nation.
Higher-wage services industries lead Arizona’s growth.
Change in Employment by Industry, Arizona, 2000-2011
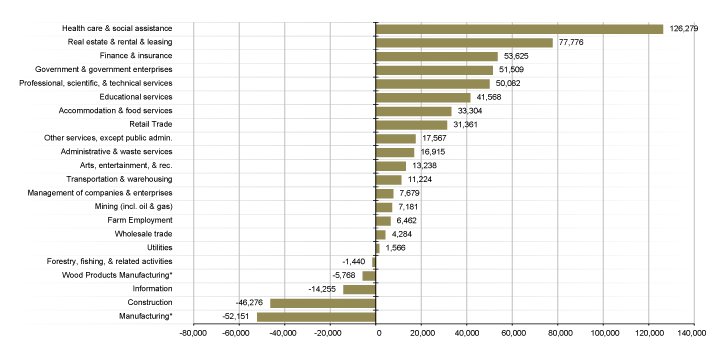
From 2000 to 2011, Arizona’s economy created 431,730 net new jobs, with the great majority of this growth coming from services industries, many of them high paying. The fastest growing sectors included health care, real estate, and finance and insurance.
Protected federal lands help create more jobs…
A 2012 Arizona poll of small businesses found 73 percent support designating more of Arizona’s existing public lands as national monuments to help ensure natural areas and water in these regions enjoy protections similar to those of Montezuma Castle, the Grand Canyon and the Petrified Forest in Arizona.
Percent Change in Employment,
Non-Metro West, 1970-2010
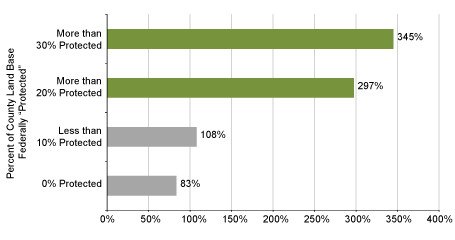
From 1970 to 2010, western non-metro counties with more than 30% of the county’s land base in federal protected status increased jobs by 345%. As the share of federal lands in protected status goes down, the rate of job growth declines as well. Non-metro counties with no protected federal land increased jobs by 83%.
…and contribute to higher incomes.
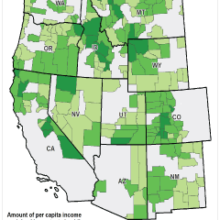
Average Increase in Per-Capita Income from Protected Public Lands for Non-Metro West, 2010
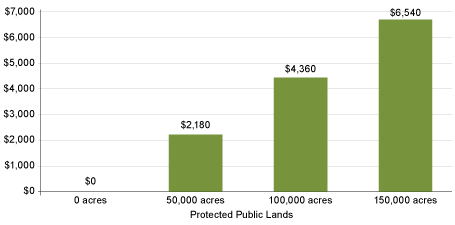
On average, western non-metro counties have a per capita income that is $436 higher for every 10,000 acres of protected federal lands within their boundaries.
References
- The West is defined as the 11 public lands continental western states: Arizona, California, Colorado, Idaho, Montana, Nevada, New Mexico, Oregon, Utah, Washington, and Wyoming. “Protected” federal lands include areas such as National Parks, Wilderness, National Monuments, National Conservation Areas, National Recreation Areas, National Wild and Scenic Rivers, and National Wildlife Refuges. For more details, see: the full report.
- Non-Metropolitan counties are counties without an urbanized area of 50,000 or more population, or a high degree of social and economic integration with a Metropolitan Statistical Area as measured by commuting ties.
- Data in this publication are from: U.S. Department of Commerce. 2012. Bureau of Economic Analysis, Regional Economic Information System, Washington, D.C.; U.S. Department of Commerce. 2012. Census Bureau, Population Division, Washington, D.C.; U.S. Department of Commerce. 2012. Bureau of Economic Analysis, Regional Economic Information System, Washington, D.C.; U.S. Department of Commerce. 2011. Census Bureau, County Business Patterns, Washington, D.C.; AZ Land Resources Information System, 2009; MT Natural Heritage Program, 2008; Conservation Biology Institute, 2008 (for CA); Conservation Biology Institute, 2006 (for remaining states).
- Details on the per-capita income study are in our Technical Report.
- Some industry categories have been modified from the original source to better illustrate employment in sub-sectors that are important to the western economy. Wood Products Manufacturing is a sub-set of total Manufacturing and consists of the wood product (NAICS 511) and paper (NAICS 537) manufacturing sectors. The Bureau of Economic Analysis does not report employment at this NAICS level (i.e., the 3-digit level), but does provide personal income at this level. To estimate employment for these sectors at the 3-digit level, we calculated a ratio consisting of personal income earned in these sectors divided by personal income earned in all manufacturing. We multiplied this ratio by total manufacturing employment to estimate the number of jobs in wood products and paper manufacturing. Manufacturing consists of total manufacturing minus Woods Products Manufacturing. Forestry is part of Forestry, Fishing, Related Activities, and Other and consists of the non-manufacturing components of the timber industry, such as growing and harvesting.
- Polling results are from Small Business Majority Polling.