- In the past 50 years, the number of single-family homes in the High Divide has close to tripled, from roughly 28,000 homes in 1963 to 75,000 in 2013.
- During that time, just more than half of these new homes were built outside of town centers in unincorporated portions of the High Divide counties. Since 2010, this trend has increased and 63 percent of new homes were built outside of town.
- In the last half century, the number of new homes built in the Wildland-Urban Interface (the area within ½ mile of forested public lands) has increased by more than 300 percent, from more than 2,000 homes in 1963 to 9,000 homes in 2013.
- In the next 10 years, nearly 150 square miles of currently undeveloped private land (an area equal to one half of all private land in Teton County, Idaho) is forecasted to experience low-density “exurban” development.
Summary
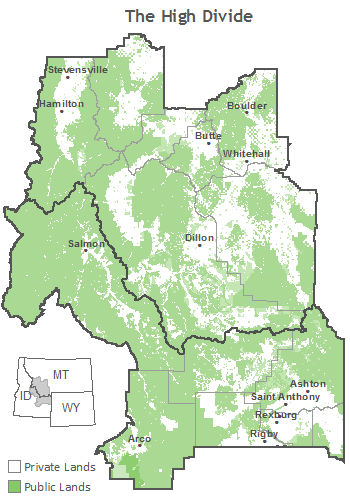
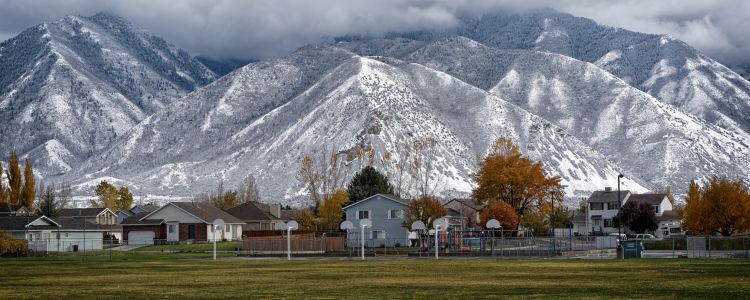
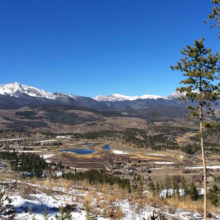
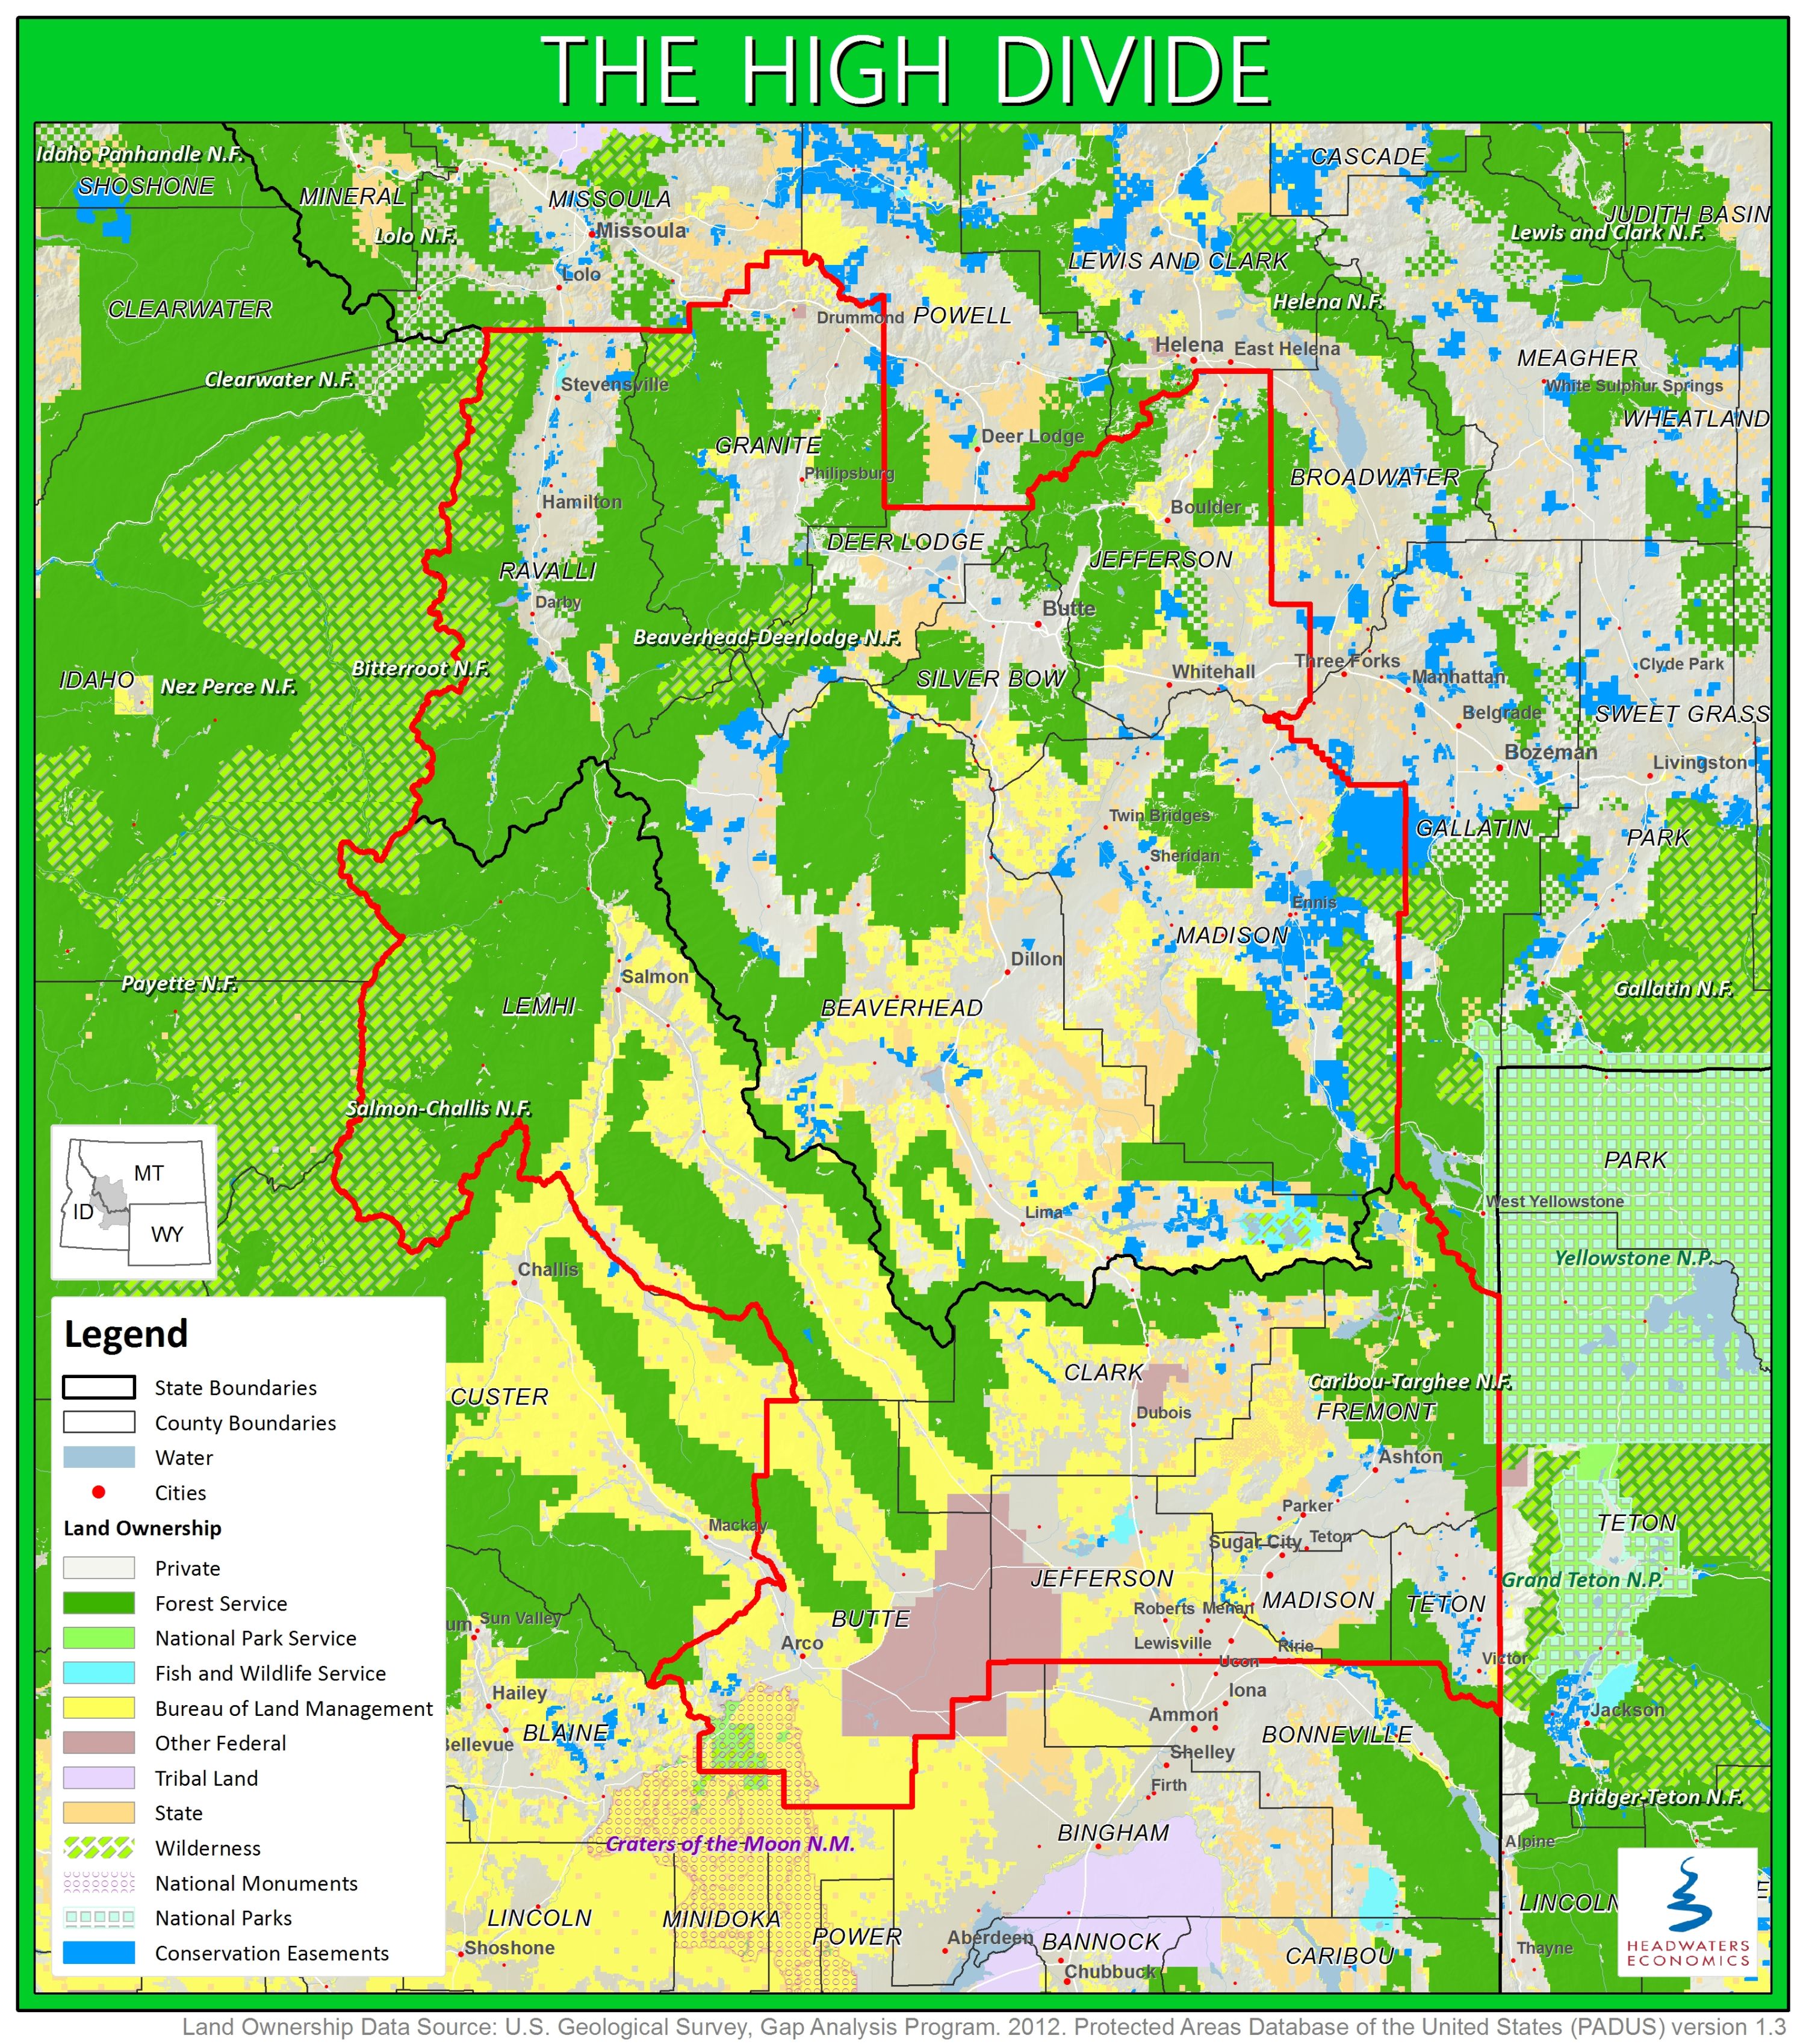
The High Divide region straddles the Idaho-Montana border between Yellowstone National Park and the Central Idaho Wilderness Complex, and is known for its working landscapes, beauty, and wildlife. The region is facing challenging planning and growth management choices, particularly as the economy and land market recover from the latest recession.
As new residents move to the High Divide, housing patterns are changing the rural landscape, traffic patterns, farming and ranching uses, wildlife habitat, and wildfire risk. Headwaters Economics has produced detailed map data showing past and forecasted trends in home construction for the region. Below we summarize development trends and provide downloadable GIS housing data that can be used to measure growth and its impacts.
Overview: Growth Trends by County
The High Divide is attracting many new residents and home construction is changing the landscape. In the past 50 years, the number of single-family homes in the High Divide has close to tripled, from roughly 28,000 homes in 1963 to 75,000 in 2013.
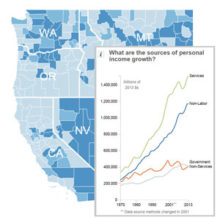
Currently, higher densities of people and homes are present in the northern part of the High Divide, although the growth trajectories vary widely among High Divide counties.
For example, Ravalli County, Montana, south of the city of Missoula, has more than 15,000 homes and has experienced relatively sustained and rapid growth since the 1970s. In contrast, Silver Bow County, Montana, where the historical mining city of Butte is located, has nearly 12,000 homes, but construction has been declining since the 1950s with generally fewer homes being built each decade. [Note: you can click on an individual county in the interactive map to the left to view county-specific data in the charts.]
The rate of home construction in the High Divide generally has tracked national periods of economic growth and recession. This is true for the majority of counties.
However, the High Divide also includes remote, small population counties, such as Clark and Butte counties in Idaho, where, regardless of recessions, the rate of home constructions in the past 50 years has averaged fewer than five homes per year.
Overall, home construction in the High Divide during the 2000 to 2010 period outpaced any previous decade. However, the interactive map and charts show that peaks in growth vary widely between counties.
Fremont County, Idaho, known as a recreation destination for anglers and snowmobilers, experienced its highest rate of home construction during the 1970s. While Teton County, Idaho, just west of Jackson, Wyoming, has experienced rapid growth in housing since the 1960s, but was hit hard by the recent recession.
Out-of-Town Growth Trends
In the past 50 years, 51 percent of new homes were built outside of town centers in unincorporated portions of High Divide counties.
Since 2010, this trend has increased and 63 percent of new homes were built outside of town.
This trend of an increasing amount of development occurring outside of town centers will impact and compromise the future of important working lands, scenery, and wildlife habitat for many of the iconic wildlife species associated with the High Divide, including elk, pronghorn antelope, grizzly bear, and wolverine.
Dispersed homes also restrict hunting opportunities, limit scenic vistas and open spaces, and increase potential conflicts with agricultural land owners.
Among High Divide counties, there is a high degree of variability in the amount of out-of-town growth. For example, in Jefferson and Madison Counties in Idaho, 19 percent of homes built since 2000 were built out-of-town. By contrast, in Madison County, Montana, 91 percent of homes built since 2000 were built out-of-town.
Growth in the Wildland-Urban Interface
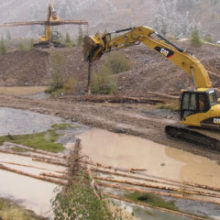
Much of the High Divide is heavily forested and considered to be high-risk in terms of wildfire danger.
The challenge of protecting a growing number of homes in the Wildland-Urban Interface (the area within ½ mile of forested public lands) has added substantially to firefighting costs.
[Note: we use a standard definition of the Wildland-Urban Interface that focuses on proximity to forested landscapes, but there are challenges in shrub and grasslands as well.]
As wildfires become more frequent, severe and expensive, there is a growing need to manage the pace, scale, and pattern of future development in fire-prone landscapes.
In the past 50 years, the number of new homes in the High Divide built in the Wildland-Urban Interface has increased by more than 300 percent, from 2,187 in 1963 to 8,915 in 2013.
Fremont County in Idaho and Jefferson and Ravalli Counties in Montana experienced the fastest rates of home development in the Wildland-Urban Interface since 2000. In the southern part of the High Divide, Clark, Butte, Jefferson, and Madison Counties in Idaho have relatively little forest cover.
Forecasted Development
In the next 10 years, nearly 150 square miles of currently undeveloped private land (an area equal to one half of all private land in Teton County, Idaho) is forecasted to experience low-density “exurban” development.
Headwaters Economics developed both historical and forecasted housing data based on county tax assessor records, which are used for collecting property taxes and are a reliable data source.
For each High Divide county, we collected the location and year-built for every single-family home. The tax assessors provided home locations in “Quarter Sections”, which are 160-acre blocks of land delineated by the Public Land Survey Section System.
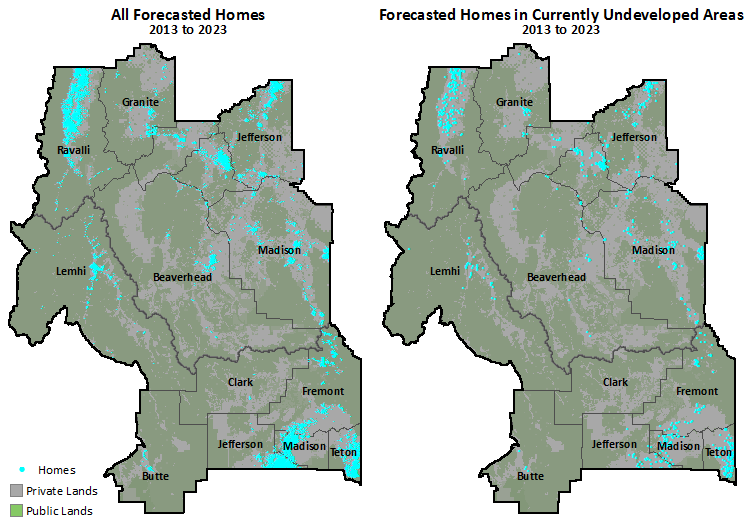
Headwaters Economics then generated a 10-year forecast based on the development patterns that occurred from 2003 to 2013, the latest year of available historic data. The forecasts show where and how much development might occur by 2023. Since so many factors, including national and global economic markets, impact the pace of home construction, it is more appropriate to view the forecast as an indicator of development potential rather than a prediction.
See a “time series” of maps that show historical and forecasted housing in the High Divide.
Methods
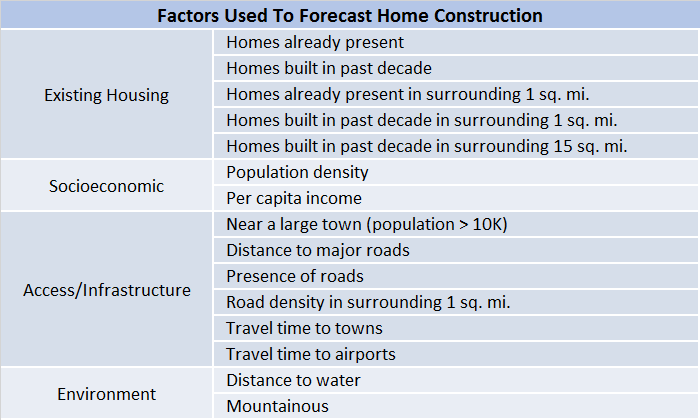
Below we list the factors used in the forecasting model. We quantified the relationship between the listed factors (see table below) and home construction using a statistical model called a negative binomial regression. Headwaters Economics consulted with the Statistics Department at Montana State University to select the modeling technique.
The forecasting model was designed to estimate home construction for each Quarter Section. We assessed accuracy by comparing the actual number of homes built per quarter section from 2003 to 2013 to the model estimates for the same period.
Model Accuracy in the “Rural” High Divide
Despite the fact that rural development occurs over a larger area, the model performs well in rural areas, defined here as further than a 15-minute drive from the nearest population center with greater than 10,000 residents (Idaho Falls, ID; Rexburg, ID; Jackson, WY; Butte, MT; Helena, MT; and Missoula, MT).
The model correctly predicted whether or not homes would be built in 99 percent of rural quarter sections where no homes were present in 2003 (see table below). For rural areas with homes already present, the model correctly predicted whether or not homes would be built in 81 percent of quarter sections. In both of these cases, the model was conservative, sometimes under-predicting growth in rural areas.
Accuracy in the “Urban” High Divide
Accuracy in the more urban parts of the High Divide was lower, although still relatively high for locations without existing development. For the areas within a 15-minute drive of Idaho Falls, ID; Rexburg, ID; Jackson, WY; Butte, MT; Helena, MT; and Missoula, MT, the model correctly predicted whether or not homes would be built in 79 percent of rural quarter sections where no homes were present in 2003.
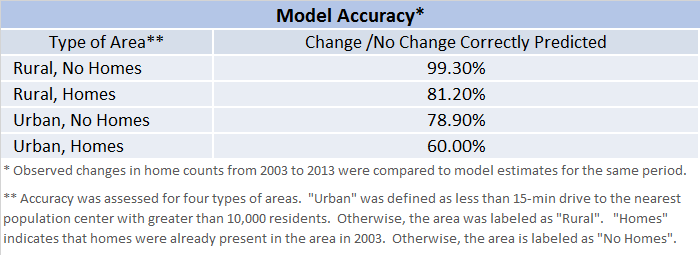
For more urban areas with homes already present, the model correctly predicted whether or not homes would be built in 60 percent of quarter sections. In urban areas with existing housing, the model tended to over-predict new home construction.
Future Trends in Housing
The model is most useful for investigating what areas may be affected by different levels of development pressure in the near future. For example, roughly 150 square miles of currently undeveloped private land is forecasted to experience low-density “exurban” development.
The total amount of forecasted growth is consistent with the amount of growth observed during 2003 to 2013. Since national and global economic trends impact the pace of home construction, the model is not useful for predicting specific home counts. It is more useful for examining where no homes, some, or many are predicted.
Downloadable GIS Data
GIS Data summarizing the number of homes present in 2013 per Public Land Survey Section are available for download.
Please contact Headwaters Economics should you have additional data information requests.

