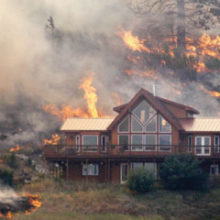
This digest summarizes recent research on how growing residential development in Oregon has led to increases in fire suppression costs. The research focused on 33 wildland fires during 2006-2010. The full report is entitled “How much do homes contribute to wildfire suppression costs?” (3.8M PDF). (Also see these report slides.)
Report Highlights
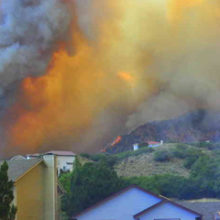
- Rising average summer temperatures are strongly associated with an increase in the number of wildfires. In Oregon, an increase in average summer temperature of 1°F is associated with an increase of 420 wildfires. This is a large effect given that, on average, 1,800 wildfires burn in Oregon per year.
- Based on data for 19 Oregon counties, home construction in the WUI was most rapid from 1977-1980, when an average of 529 WUI homes were built per year. The next highest rate occurred in 2006, just prior to the recession, when 418 WUI homes were built.
Homes Built Per Year in the Oregon WUI

- Of the 33 Oregon wildfires studied, the average cost to protect a home within 6 miles of the fire was $56,614, but ranged significantly, in some fires costing more than $200,000 per home. The estimated cost related to housing for the 33 study fires ranged from none to 42 percent, and averaged 17 percent. This added up to almost $42 million spent to protect homes (out of a total firefighting bill of more than $250 million).
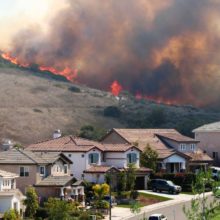
- Building new homes in otherwise undeveloped areas has the greatest potential to increase firefighting costs. Conversely, lower firefighting costs are associated with individual homes in densely developed areas. This is likely because when large numbers of homes are present, fire managers are already investing all available resources to stop the fire. For example, using the average daily firefighting cost within our sample ($700,911), the model predicts an increase in suppression costs of $31,545 if two homes instead of one were within 6 miles of the wildfire. By comparison, the model predicts an increase of only $319 if 100 homes instead of 99 were within 6 miles of the wildfire.
Policy Implications
- Keeping new housing within denser residential areas would reduce future firefighting costs by millions of dollars. Leaving land undeveloped saves the most taxpayer dollars.
- Today federal and state taxpayers pay a large portion of the cost of wildfires. If costs instead were borne in part by those who build at-risk homes, or by local governments who permit them, it would help pay for rising costs and may discourage new home development in high risk areas.

| Fire | Cumulative Cost | Year | Agency | Firefighting Days | Avg Size of Fire (sq.km.) | Avg Homes within 6 mi | Estimated % of Cost Related to Housing | Estimated Cost Related to Housing | Avg Cost per Home within 6 mi of the Fire |
|---|---|---|---|---|---|---|---|---|---|
| Ball Point | $3,075,788 | 2007 | USFS | 17 | 5 | 427 | 32% | $974,995 | $2,282 |
| Big Sheep Ridge | $1,217,673 | 2009 | USFS | 10 | 13 | 141 | 25% | $307,531 | $2,176 |
| Black Butte II | $3,080,983 | 2009 | USFS | 7 | 3 | 937 | 36% | $1,123,770 | $1,199 |
| Blister | $5,726,503 | 2006 | USFS | 22 | 2 | 1 | 3% | $183,227 | $183,227 |
| Boze | $7,019,985 | 2009 | USFS | 22 | 23 | 0 | 0% | $24,957 | $224,614 |
| Bridge Creek | $4,410,206 | 2008 | USFS | 11 | 19 | 131 | 25% | $1,094,958 | $8,377 |
| Calamity Complex | $3,652,755 | 2007 | USFS | 14 | 8 | 22 | 15% | $560,979 | $25,118 |
| Canal Creek | $4,735,060 | 2009 | USFS | 11 | 1 | 0 | 0% | $0 | na |
| Cougar Creek | $2,544,887 | 2009 | USFS | 10 | 3 | 593 | 34% | $855,357 | $1,444 |
| Cougar Ridge | $1,657,848 | 2009 | USFS | 20 | 1 | 1 | 3% | $53,045 | $53,045 |
| Egley Complex | $16,296,760 | 2007 | USFS | 19 | 294 | 64 | 18% | $2,970,854 | $46,347 |
| Elkhorn Complex | $3,985,253 | 2006 | USFS | 15 | 4 | 404 | 31% | $1,249,754 | $3,095 |
| Gnarl Ridge | $15,047,477 | 2008 | USFS | 28 | 11 | 130 | 25% | $3,727,722 | $28,738 |
| GW Fire | $7,917,759 | 2007 | USFS | 23 | 26 | 700 | 34% | $2,691,478 | $3,845 |
| Ironside | $1,667,362 | 2007 | BLM | 9 | 1 | 25 | 16% | $266,045 | $10,642 |
| Kitson | $4,302,039 | 2008 | USFS | 13 | 3 | 44 | 19% | $812,339 | $18,462 |
| Lake George | $12,367,001 | 2006 | USFS | 34 | 13 | 16 | 12% | $1,503,077 | $92,025 |
| Lonesome Complex | $18,411,841 | 2008 | USFS | 55 | 41 | 3 | 3% | $515,770 | $176,448 |
| Monument Complex | $11,634,250 | 2007 | USFS | 22 | 167 | 144 | 25% | $2,881,029 | $20,007 |
| Mt. Hood Complex | $8,514,319 | 2006 | USFS | 25 | 5 | 14 | 13% | $1,107,921 | $80,414 |
| North Fork Complex 08 | $9,274,059 | 2008 | USFS | 24 | 2 | 9 | 7% | $663,799 | $73,755 |
| North Fork Complex 09 | $5,250,859 | 2009 | USFS | 59 | 14 | 8 | 10% | $545,100 | $69,885 |
| Oak Flat | $18,738,968 | 2010 | USFS | 27 | 17 | 17 | 14% | $2,579,344 | $153,991 |
| Rattle | $21,057,784 | 2008 | USFS | 37 | 50 | 18 | 14% | $3,014,458 | $167,470 |
| Rooster Rock | $5,609,299 | 2010 | USFS | 9 | 19 | 2249 | 42% | $2,356,225 | $1,048 |
| Shake Table Complex | $15,264,142 | 2006 | USFS | 24 | 42 | 65 | 19% | $2,932,932 | $45,023 |
| Silvies River | $2,531,835 | 2008 | BLM | 8 | 13 | 13 | 13% | $317,572 | $25,406 |
| Spear Spring | $1,073,010 | 2007 | USFS | 6 | 2 | 7 | 10% | $106,328 | $15,190 |
| Trout Meadows | $6,569,023 | 2007 | USFS | 23 | 14 | 1 | 3% | $210,185 | $210,185 |
| Twin Lakes Complex | $4,538,513 | 2006 | USFS | 17 | 35 | 206 | 27% | $1,242,856 | $6,033 |
| Ukiah Complex | $4,356,664 | 2007 | USFS | 11 | 14 | 126 | 24% | $1,042,398 | $8,306 |
| Williams Creek Fire | $14,630,640 | 2009 | USFS | 21 | 21 | 60 | 20% | $2,937,497 | $49,017 |
| Wizard | $3,994,788 | 2008 | USFS | 12 | 5 | 232 | 28% | $1,122,754 | $4,839 |
| Total: | $250,155,334 | $41,976,256 | |||||||
| Average estimated cost related to housing for the 33 study fires: 17% (ranged from 0% to 42%) Average estimated cost per home within 6 mi. for the 33 study fires: $56,614 (ranged from $1,048 to $224,614) |
|||||||||