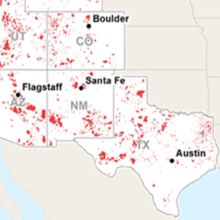
As land agencies and residents across the country are preparing for the next wildfire season, a new interactive mapping tool developed by Headwaters Economics identifies communities at risk by wildfires from 2000 to 2014.

The interactive map allows users to identify the location, scale, and frequency of wildfire threats to their communities.
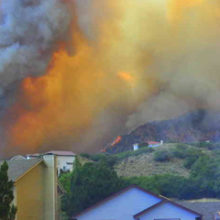
Unseasonably warm temperatures and ongoing drought suggest many places, particularly in the American West, are adversely exposed to wildfires in the coming months.
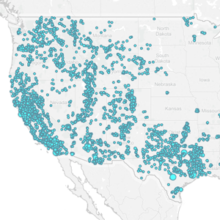
The map interactive identifies where and when wildfires have occurred, which can aid in prioritizing wildfire threats, directing resources, and enhancing community planning capacities. The map also shows the different sizes of wildfires and distances from nearby communities.
Users can select criteria such as the size or number of nearby wildfires to filter the display of qualifying communities.
In addition, a pop-up window for each community provides additional information on the size, frequency, and year of wildfire events.
For example, in setting the criteria to more than five moderately sized wildfires burning within two miles of the community boundary, 10 communities are highlighted including Reno (NV), Boise (ID), and Moreno Valley (CA).
If local governments are interested, Headwaters Economics also is working with Wildfire Planning International to provide Community Planning Assistance for Wildfire (CPAW).
Communities can apply for a CPAW assistance grant to help reduce wildfire risk within the wildland-urban interface through improved land use planning.
Methods and Measuring Communities at Risk
Headwaters Economics also created a sortable data table that identifies frequently threatened towns and cities, including the different sizes and distances of wildfires from nearby communities.
Data on wildfire histories was collected from the Geospatial Multi-Agency Coordination Group (GeoMAC) and distances were measured using Census Designated Place boundaries.