• Skip to primary navigation
  • Skip to main content
  • Skip to footer
Headwaters Economics

Headwaters Economics

Independent Nonpartisan Research

  • Research
    • Economic Development
    • Equity
    • Natural Hazards
    • Public Lands
    • Outdoor Recreation
    • Tax Policy
  • Tools
  • About Us
  • Search

New Mexico’s Economy and the Role of Federal Protected Lands

March 2012

This report summarizes New Mexico’s economy and the role of federal protected lands. It analyzes how the state has performed, what is driving economic growth, and how protected lands such as national parks and monuments play a positive role in attracting people and investment, while growing businesses and jobs in New Mexico.
Download Report PDF

New Mexico’s economy is growing and outperforming the broader U.S. economy.

Growth measures, New Mexico 1970-2010

Chart: Growth measures, New Mexico 1970-2010
From 2000 to 2010, New Mexico’s population grew by 13%, employment 10%, and real per capita income 16%. Over the same time period, real personal income grew by 31%, driven by high quality jobs and a rapid growth of investment and retirement income.


New Mexico vs U.S., Percent change 2000-2010

Chart: New Mexico vs U.S., Percent change 2000-2010

From 2000 to 2010, New Mexico’s population grew substantially while adding new jobs and real personal income at twice the national rate, and real per capita income at four times the national rate.

Text: From 2000 to 2010, New Mexico's real personal income grew by 31%


New Mexico’s prosperity depends on being able to attract people with the talents and creativity required to remain competitive in the 21st century. Such people are drawn by natural beauty and amenities, making New Mexico’s environmental quality a key asset for continued growth.

–Dr. Christopher Erickson
Department of Economics
New Mexico State University

Read more +

High wage services industries led New Mexico’s job growth, diversifying the state’s economy.

Change in employment by industry, New Mexico 2000-2010

Chart: Change in employment by industry, New Mexico 2000-2010
From 2000 to 2010, New Mexico’s economy created 99,799 new jobs, with 99% of this growth coming from service-related industries. The fastest growing sectors included health care, professional services, government, and real estate.


Employment by industry, percent of total, New Mexico 2010

Chart: Employment by industry, percent of total, New Mexico 2010
The state’s diverse industry mix means that assets–such as quality education and unique federal public lands–that attract people and business across a range of services sectors are critical to New Mexico’s economic future.

New Mexico is attracting people and investment, while creating jobs faster than the U.S.

Research shows that people are drawn to areas for their quality of life and natural amenities, bringing investment income and business connections to the larger world.

Text: From 2000 to 2009, New Mexico created 58,382 net new wage and salary jobs


Share of population growth, New Mexico 2000-2010

Chart: Share of population growth, New Mexico 2000-2010

Change in wage and salary employment, 2000-2010

Chart: Change in wage and salary employment, 2000-2010

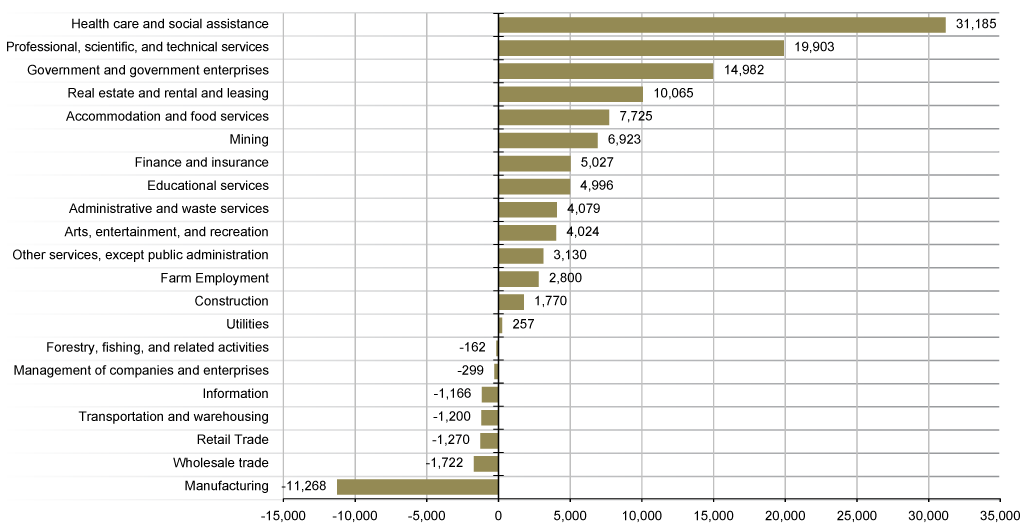
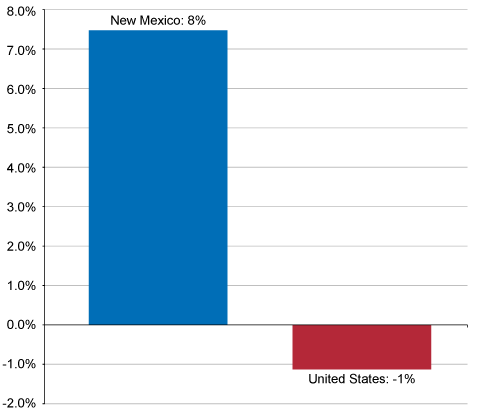
From 2000-2010, New Mexico created 58,382 net new wage and salary jobs, an increase of 8%. In the U.S. over the same time period, the number of wage and salary jobs shrank by 1%.


Dividends, interest, and Rent, New Mexico 1970-2010

Chart: Dividends, interest, and rent, New Mexico 1970-2010
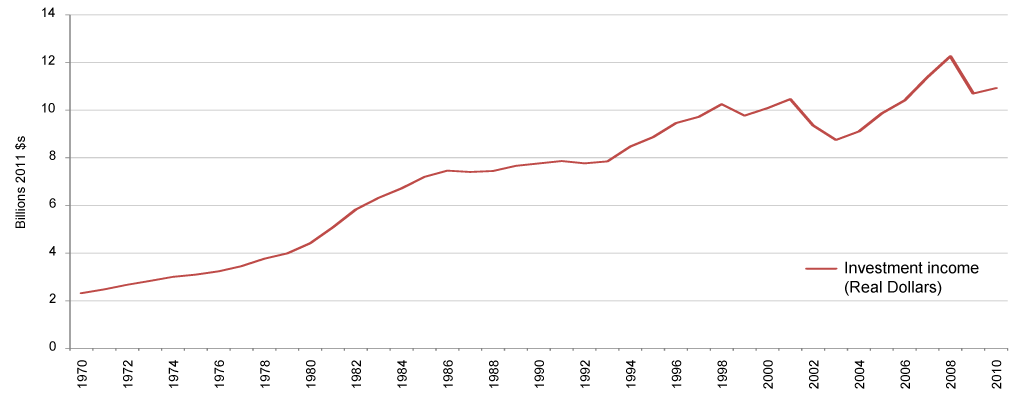
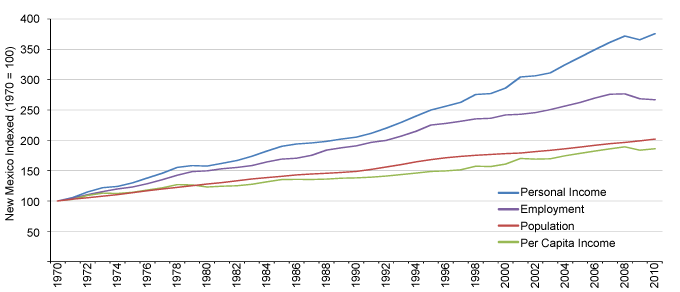
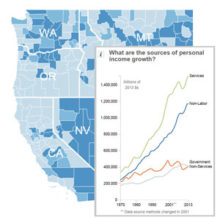
From 1970 to 2010, investment income–dividends, interest, and rent–increased from $2.3 to $10.9 billion, in real terms, a 372% gain. In 2010, investment income was 15% of total personal income in the state. Combined with transfer payments, which are mostly
age-related, non-labor income made up 38% of total personal income in 2010.

Economists believe protected federal lands are an important driver of economic growth.

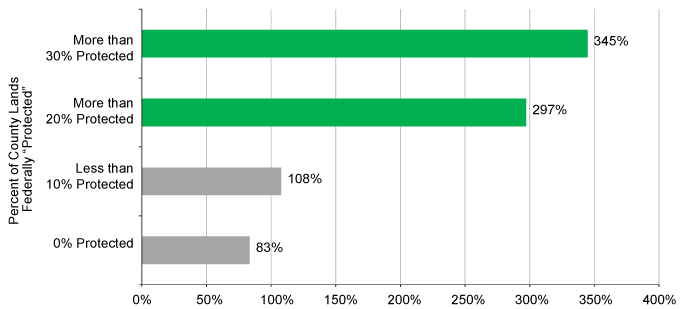
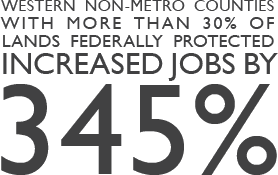
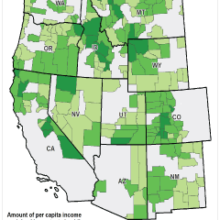
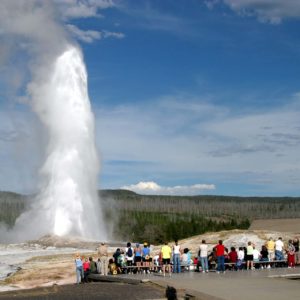
Across New Mexico and the West, protected federal lands such as national parks, monuments, and wilderness areas are associated with higher rates of job growth.


Percent change in employment, western non-metro counties 1970-2010

Chart: Percent change in employment, western non-metro counties 1970-2010
From 1970 to 2010, western non-metropolitan counties with more than 30 percent federal protected land increased jobs by 345%. By comparison, non-metro counties with no protected federal lands increased employment by 83%.

Text: Western non-metropolitan counties with more than 30 percent federal protected land increased jobs by 345%.png

New Mexico federal lands

Map: New Mexico federal lands

The critical natural capital inherent in protecting public lands generates a wide variety of benefits essential to economic development and sustainable communities across New Mexico.

–Dr. Robert Berrens
Chair, Department of Economics
University of New Mexico

References

The West is defined as the 11 public lands continental western states: Arizona, California, Colorado, Idaho, New Mexico, Nevada, New Mexico, Oregon, Utah, Washington, and Wyoming.

“Protected” federal lands include areas such as National Parks, Wilderness, National Monuments, National Conservation Areas, National Recreation Areas, National Wild and Scenic Rivers, and National Wildlife Refuges. For more details, see: EPS-HDT: Technical Information.

More than 100 economists recently urged the President to protect federal lands as an important economic asset. See: “Economists Urge President Obama to Protect Federal Public Lands.”

Lorah, P. R. Southwick, et al. 2003. Environmental Protection, Population Change, and Economic Development in the Rural Western United States. Population and Environment 24(3): 255-272; McGranahan, D. A. 1999. Natural Amenities Drive Rural Population Change. E. R. S. U.S. Department of Agriculture. Washington, D.C.

Non-Metropolitan counties are counties without an urbanized area of 50,000 or more population, or a high degree of social and economic integration with a Metropolitan Statistical Area as measured by commuting ties.

Data in this publication are from: U.S. Department of Commerce. 2012. Bureau of Economic Analysis, Regional Economic Information System, Washington, D.C.; U.S. Department of Commerce. 2012. Census Bureau, Population Division, Washington, D.C.; U.S. Department of Commerce. 2012. Bureau of Economic Analysis, Regional Economic Information System, Washington, D.C.; U.S. Department of Commerce. 2011. Census Bureau, County Business Patterns, Washington, D.C.; AZ Land Resources Information System, 2009; MT Natural Heritage Program, 2008; Conservation Biology Institute, 2008 (for CA); Conservation Biology Institute, 2006 (for remaining states).

For More Information

Dr. Ray Rasker, Ph.D., Executive Director, Headwaters Economics, , 406-570-7044.

Headwaters Economics is an independent research group whose mission is to improve community development and land management decisions in the West.

Related Visualization

Related data visualizationDataViz

Resources

https://headwaterseconomics.org/news/panel-discusses-ideas-to-reduce-future-wildfire-risks
Published on March 11, 2012Posted under Economic DevelopmentTags: County Payments, Economic Development, Protected Lands, The Value of Public Lands, Trends & Performance

Ray Rasker, Ph.D.

  rayrasker@gmail.com       406.570.7044

Ray is the co-founder and former Executive Director of Headwaters Economics. Ray retired in 2021 and can be reached at rayrasker@gmail.com or 406 570-7044

Related Research

map of how protected public lands increase per capita income Protected Federal Lands in Non-Metro West Increase Per Capita Income
West Wide Atlas Map and Charts West-Wide Economic Atlas
Economic Impact of National Parks
The Economic Importance of National Monuments to Communities

Footer

Independent Nonpartisan Research

Contact

© 2023 Headwaters Economics, all rights reserved

  • Sitemap
  • Terms of Use
  • Photo Credits
  • Media Coverage
  • Slides
  • Contact
  • Twitter