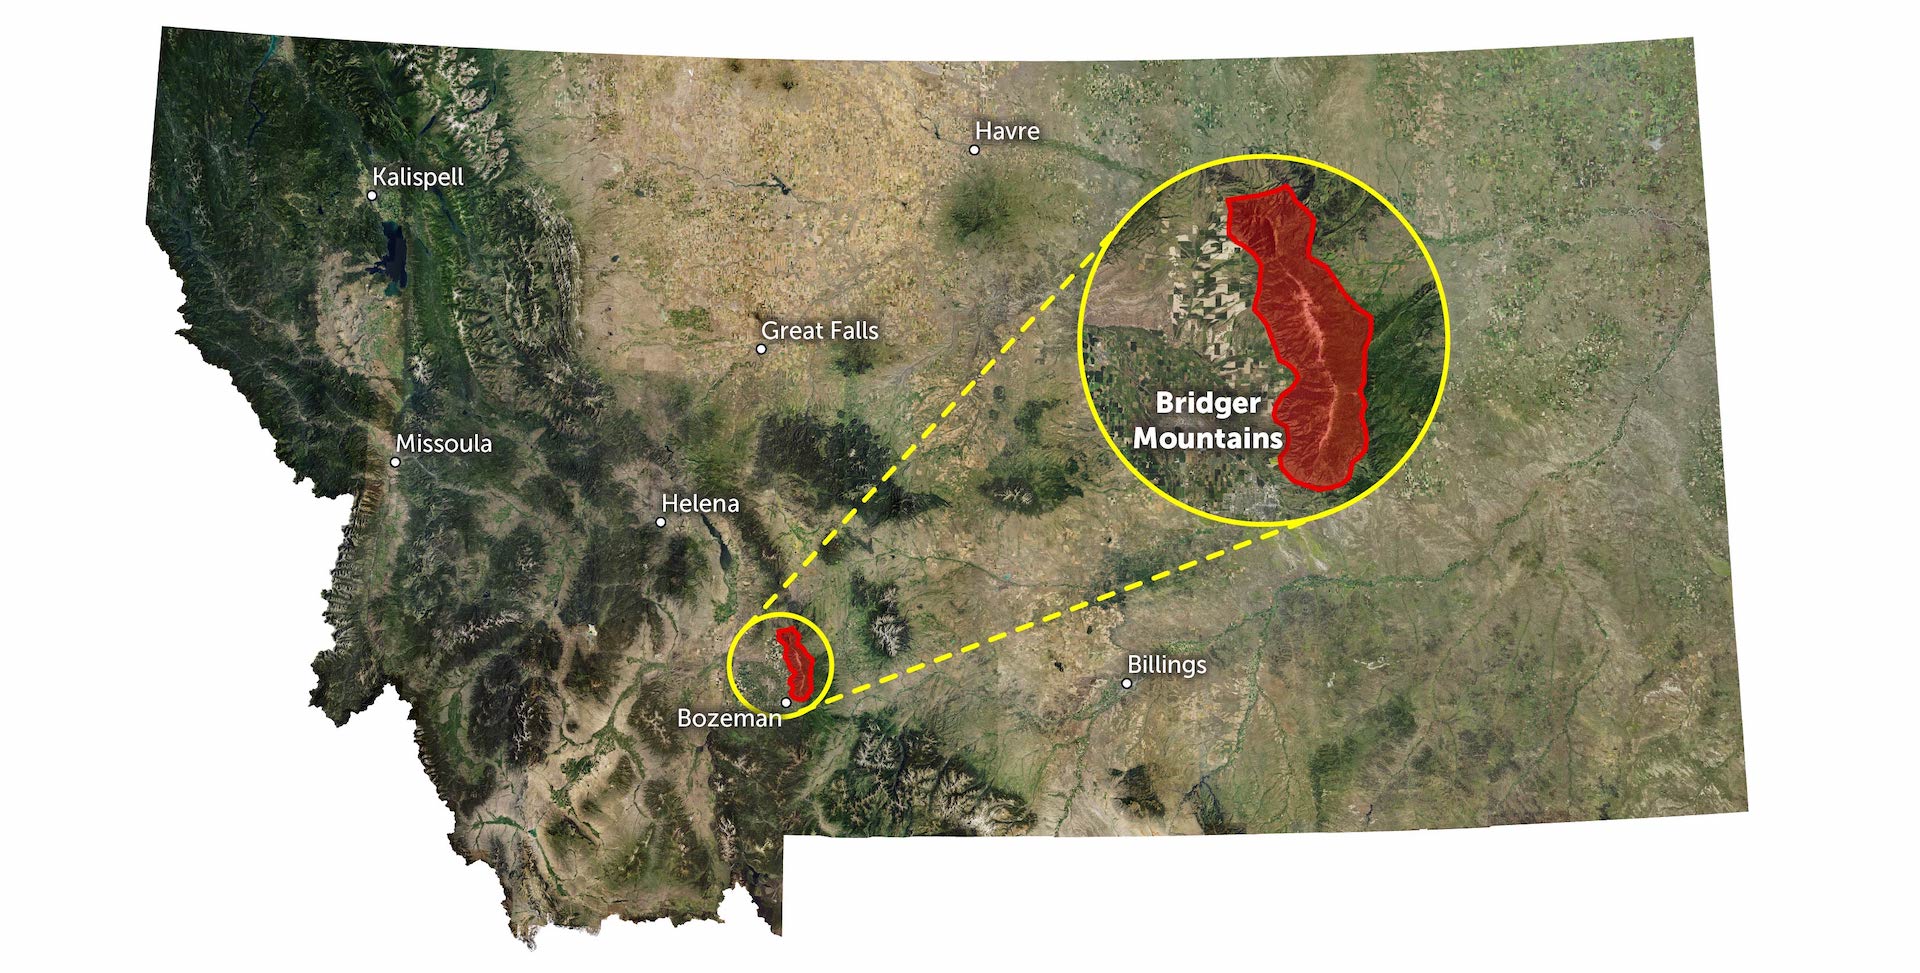
Southwest Montana’s Bridger Mountains in the Custer-Gallatin National Forest are a year-round recreational destination, vital wildlife habitat, and the backdrop for Bozeman—Montana’s fastest growing city. Headwaters Economics partnered with the U.S. Forest Service, Montana Fish, Wildlife & Parks, Gallatin County, and other partners to develop detailed estimates of summertime trail use across the Bridger Mountains. This research can help land managers plan for the impacts of growing recreational use, prioritize investments in infrastructure, and mitigate effects on wildlife.
The dashboard above allows users to identify locations, days of the week, and times of peak use during the summer months of 2021. Hover over a trail to see average daily use. Select trail(s) from the drop-down menu at the top to see data specific to that trail location. See details on data sources and methods below.
Trends in Bridger Mountains trail use
While anecdotal evidence (like crowded trailhead parking lots) indicates increasing use of Bridger Mountain trails in recent years, this study is the first time trail counts have been extensively measured in the Bridger Mountains. Among the key trends observed:
- Daily traffic on a typical summer day in the Bridgers is at least 1,700 uses.
- On a weekend day, the Bridger Mountains see more than 2,400 uses. On a weekday, it’s 1,400 uses.
- The most popular areas on a weekday are the College M trails, Middle Cottonwood, and Sypes Canyon. On a weekend, the College M trails are the most popular, followed by Sacagawea Pass and Middle Cottonwood.
More than 1,700 trips are taken on Bridger Mountain trails on a typical summer day.
Subscribe to our newsletter!
Impacts from the COVID-19 pandemic may have amplified trail use during the summer of 2021 as more people sought socially-distanced outdoor recreation. However, Montana’s outdoor recreation economy is strong and Bozeman’s growth shows no signs of slowing, so trail use is likely to continue to increase. Land managers will need ongoing and innovative strategies for measuring use in order to prioritize resources, plan for demand, and reduce impacts to wildlife and other resources.
Data sources and methods
These data were collected using infrared counters rotated across 20 trails throughout the Bridgers. Headwaters Economics received generous loans of counter equipment for this project from the U.S. Forest Service and the Gallatin Valley Snowmobile Association. The counters record a use each time the beam is broken and were installed to minimize inaccurate counts from dogs or vegetation. Because this method measures total traffic, on a trail where use predominantly is out-and-back the number of users will be approximately half of the total traffic.
At two sites (Truman Gulch and Fairy Creek), only daily data are available due to the type of counter used. At these sites, daily totals were divided by 24 to provide an hourly average.
Counters were installed for anywhere from 13 to 61 days, with an average of 29 days at each site. To ensure sufficient data were collected, counters were installed longest on trails that were more remote or had relatively low use. Counts that exceeded the mean for the hour on that day of the week plus three standard deviations were set to the mean for the day of the week for that trail. This affected 0.1% of observations.