Headwaters Economics has developed a new approach to measure recreational trail use more accurately by applying advanced statistical methods to data from infrared trail counters and cloud-based sources. The new method can dramatically increase the number of trails with use estimates compared to traditional approaches and can better account for variations in use over time or due to changes in weather and air quality.
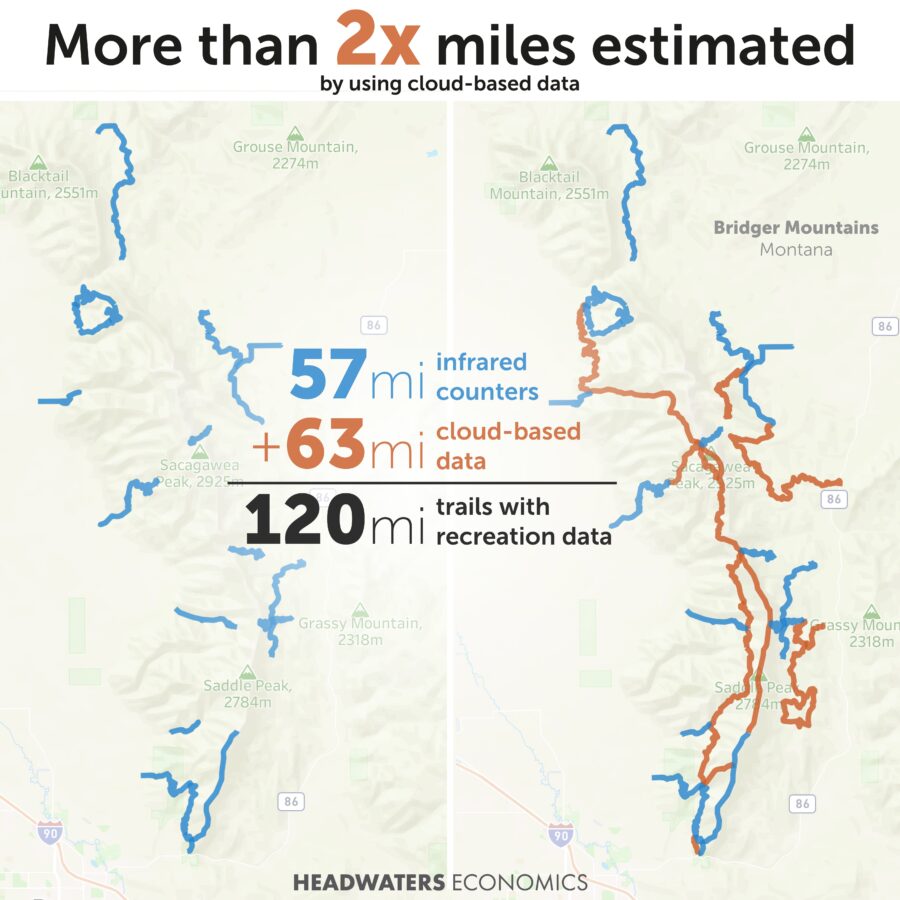
Previously only 57 miles of trails in Montana’s Bridger Mountains had accurate recreational data (left). That number increased to 120 miles (right) after applying an advanced statistical model to data from infrared trail counters and cloud-based sources.
This improvement in outdoor recreation data analysis can be a valuable new tool for land managers’ efforts to measure the impacts of outdoor recreation on public lands, guide investments in trail infrastructure, predict economic benefits, and improve wildlife management decision making. It also comes as Congress considers new programs in the proposed America’s Outdoor Recreation Act of 2023 that would prioritize measuring visitation to federal lands and waters. The method can be replicated for virtually any trail system in the United States, and can be used to easily generate maps that provide compelling insights on the impacts of trail use in a particular region. Early applications of the method in Montana’s Bridger Mountains have provided accurate estimates of trail use in areas that were previously very difficult or impossible to monitor.
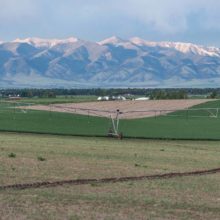
The popularity of outdoor recreation is putting pressure on land and infrastructure
Recreation on public lands has risen steadily over the past several decades, with many places experiencing dramatic increases. At the same time land managers have struggled with budgets that have not kept up with the growing demand. For example, from 2007 to 2017 the U.S. Forest Service’s recreational budget declined by 14% while recreational use increased by 5%. The pressures on trails, trailheads, and land management staff have increased even more dramatically since the pandemic began: across the United States, recreational outings increased by 14% between 2019 and 2021. In many places the result of these trends has been inadequate maintenance, overcrowding, and degraded resources.
At the same time, funds to improve public lands infrastructure are just beginning to become available to communities and federal agencies. The Great American Outdoors Act (2020) and the Inflation Reduction Act (2022) both provide hundreds of millions of dollars that will be guided toward land management, climate resilience, conservation, and maintenance backlogs.
Trails are a vital component of public land recreation, and as more communities invest in building outdoor recreation economies, trail use is only going to increase. Data on how these trails are being used will be a vital tool for land managers who must advocate for the resources required to build trailheads that can meet demand, adequately maintain facilities, and provide the high-quality experience that is the foundation for a diversified outdoor recreation economy.
Traditional methods of counting trail use are inadequate
Traditional methods to count trail use rely on periodic and single-point data collection, which are costly and labor-intensive to collect. They also come with inconvenient limits on the geographic scope of data.
For example, the U.S. Forest Service’s National Visitor Use Monitoring (NVUM) Survey provides a detailed estimate of trail use gathered from in-person surveys conducted at recreation sites once every five years. While the insights from this comprehensive survey are valuable, it is extremely labor-intensive and expensive to conduct. The long wait between updates means that land managers cannot capture dramatic changes, such as those caused by the pandemic or natural disasters.
Some recreation managers are able to invest in infrared trail counters. These are small devices set up on a specific trail that register a “use” when someone passes by. The equipment can be expensive and requires significant staff time to monitor, particularly when infrared counters are used over large areas and in complex trail networks. Periodic use of infrared counters also can miss spikes in traffic or changes in use patterns.
In the absence of more affordable and rapid solutions, some land managers have resorted to counting dog waste bags or rolls of toilet paper in outhouses to get timely estimates of trail use. Our public lands and outdoor recreation gateway communities need a better approach.
Novel data and sophisticated statistical models can improve how we count trail use
To address the data gap and overcome the costly and expensive traditional methods, Headwaters Economics and other researchers in the fields of statistical analysis and outdoor recreation are developing innovative approaches that will give agencies more timely, more comprehensive, and more accurate trail use estimates.
Headwaters Economics’ earliest efforts from 2018 attempted to model trail use by combining data from infrared trail counters on the ground with novel data sources from fitness tracking apps, websites, or cell phone location data. These methods used basic proportional estimates based on the number of trail users on a specific fitness app, such as Strava. It is a relatively simplistic approach, but it did provide a good approximation of trail use in places where no other use data was available.
For this new analysis, we applied more sophisticated statistical methods to our original approach. These new models allow us to predict trail use across complex networks. Our most recent refinements use an innovative statistical approach to combine data from multiple sources:
- User counts from on-the-ground trail counters,
- User counts from the fitness tracking app Strava,
- Hits to a trail’s website on AllTrails, and
- Geographic and physical factors that are known to affect trail use, such as distance from town, weather, and air quality.
The data visualization below shows the results of such statistical modeling across a complex network of trails in the Bridger Mountains north of Bozeman, Montana. The new method offers accurate trail use estimates across a much larger area, including trails with no infrared counters. Viewers can adjust the results for variations over time, precipitation, temperature, and air quality.
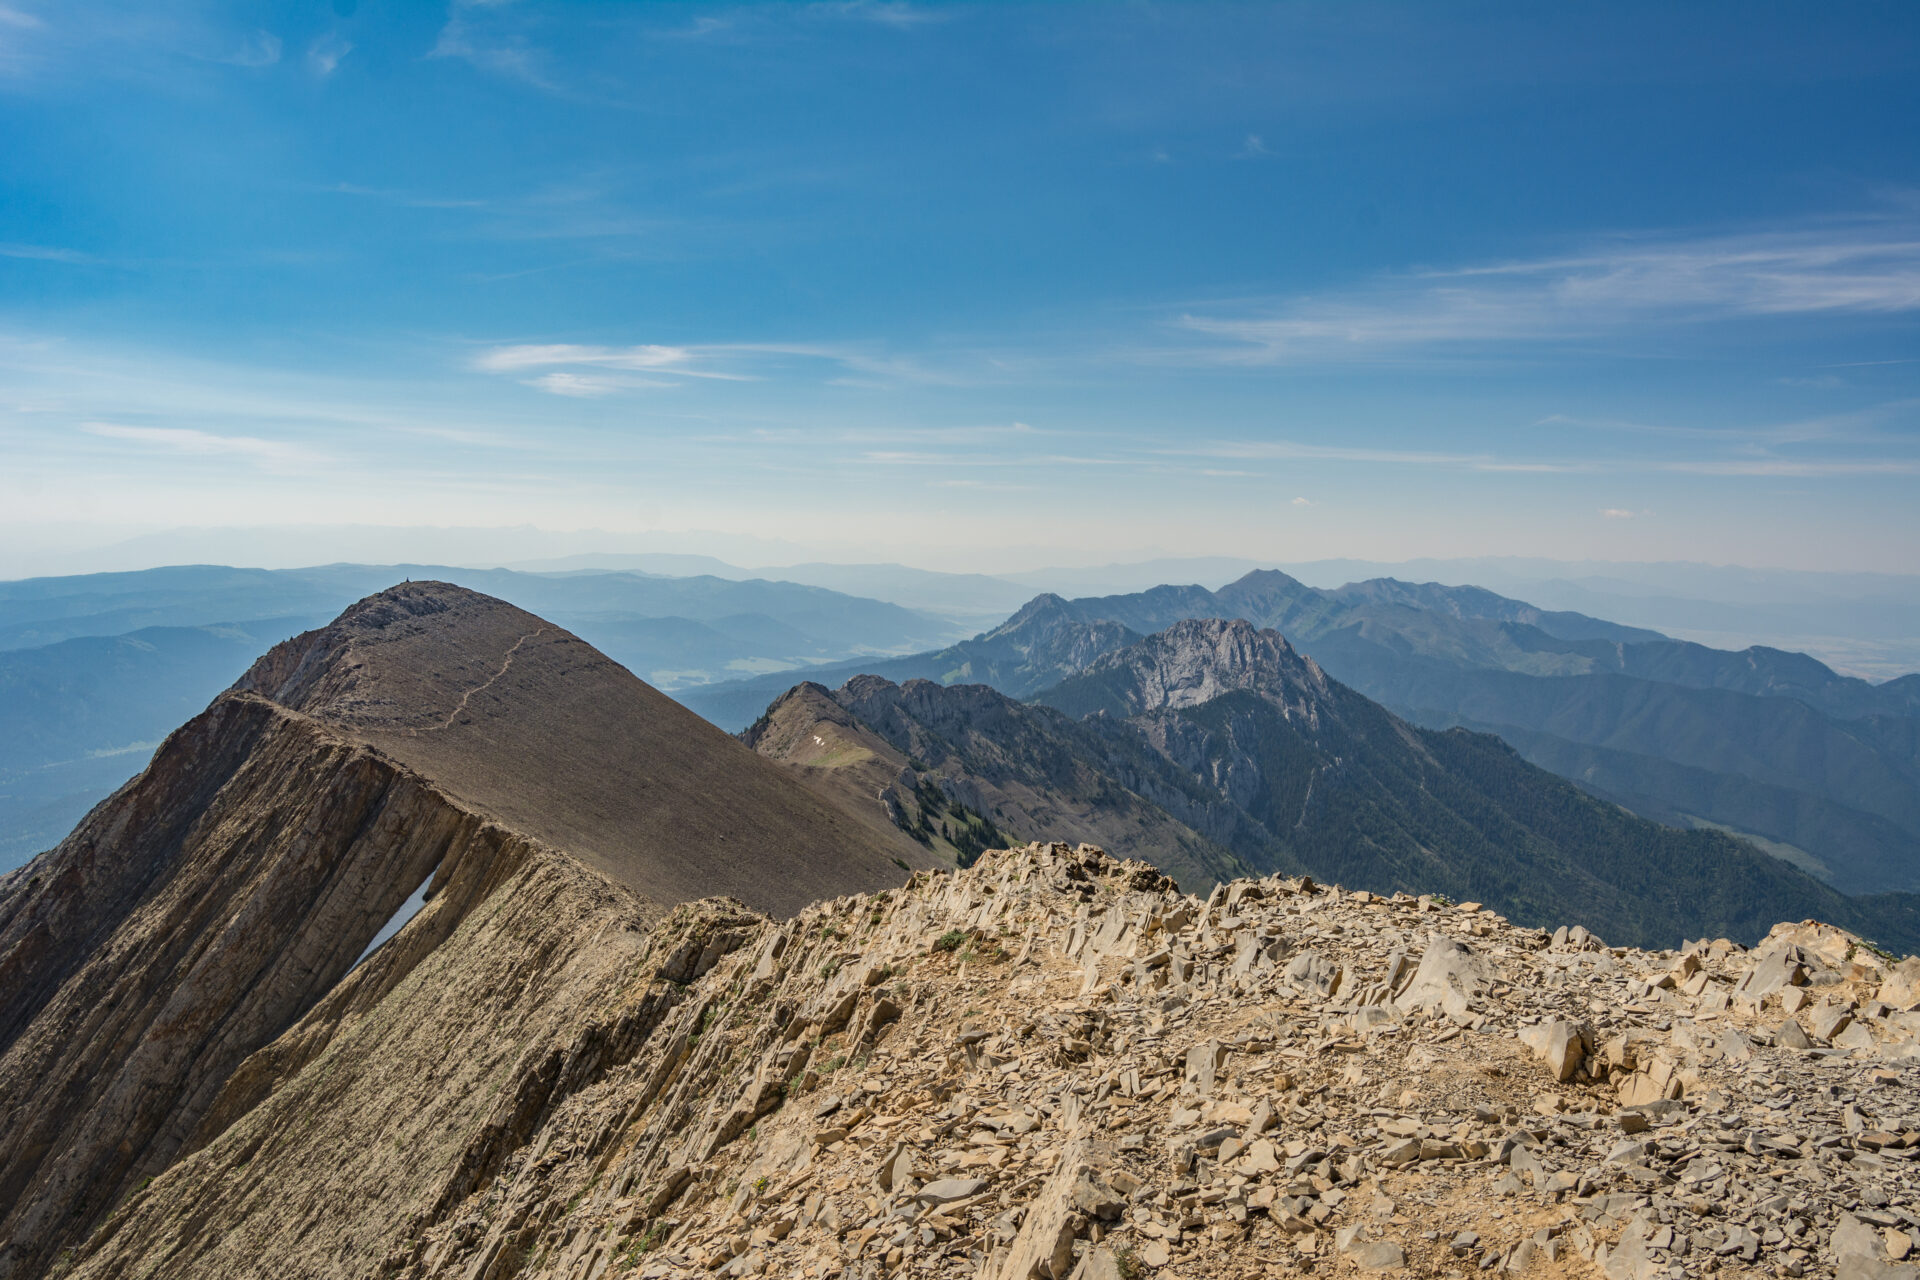
Sophisticated trail use modeling makes a strong case for how we manage outdoor recreation resources
For the analysis above, we developed a hierarchical generalized additive mixture model (HGAM). HGAM is a powerful statistical technique used in ecology, health, finance, and other fields where accurate predictions based on complex data can be exceptionally useful. However, it has rarely, if ever, been used to estimate outdoor recreation. In the case of trail use, a HGAM provides three important advantages over previous approaches.
First, this approach allows us to predict trail use across both time and space. It can provide predictions for trails where counters were not installed, or for spans of time when counters were not installed.
Second, a HGAM reflects the actual relationships between trail use and the explanatory variables rather than imposing the researcher’s prior beliefs. It allows the data to speak for itself, better capturing the complex interplay between a trail’s characteristics like terrain and distance, user habits, and weather. This approach allows us to model how climate-related factors, such as extreme heat and precipitation or poor air quality due to wildfire smoke, will affect recreational trail use.
Finally, the hierarchical GAM approach enables us to group similar trails, a particularly important feature when modeling across a large region. For example, in this study we grouped trails by trailhead, since several trailheads had multiple trails leaving a unique site. One could also group trails by primary type of use, seasonal closures, or other unique characteristics of a trail network.
Methods like these that incorporate trail counters with the latest data and statistical methods can help agencies and communities make a stronger case for supporting the development of outdoor recreation resources. Ongoing work will further evaluate the tradeoff between the accuracy of trail use estimates and the number of trail counters deployed. These kinds of insights will help recreation managers deploy trail counters strategically. The analyses presented here, scaled to all U.S. public lands, have the power to dramatically transform how outdoor recreation is developed and managed.
Methods & Data Sources
Headwaters Economics used data from infrared trail counters on 21 trails and subsections to fit several potential hierarchical generalized additive mixture models (HGAMs). We modeled the nonlinear functional relationships between covariates and counts of trail use, allowing the shape of the function itself to vary between designated trail sections while also incorporating a single common global smoother across all sections. We used the various model specifications to evaluate different spatial or temporal autocorrelation structures. Future work will explore approaches that can integrate both temporal and spatial autocorrelation.
Covariates include data obtained through partnerships with Strava Metro and AllTrails as well as trail-specific characteristics like driving distance to town and time-varying characteristics like maximum temperature, precipitation, and air quality.
We deployed infrared trail counters across the trail network between June 27 and September 30, 2021. Counters were deployed for an average of 35 days each, ranging from 12 to 59 days. Because no trail had a counter installed for the full study period, each trail presented in the map and data visualization has at least some days for which uses were estimated using the predictive statistical model. The median percent difference between actual daily trail use and estimated trail use was 38%; the mean difference is 61%. For individual trails, the average percent difference ranged from 30% to 117%. Model accuracy improves when we aggregate to the weekly scale: the median percent difference between actual and estimated trail use is 12%; the mean difference is 31%.
Acknowledgments
This research was a collaborative effort by Headwaters Economics and Meridith Bartley, Ph.D., an independent statistical consultant.
Headwaters Economics received generous loans of counter equipment for this project from the U.S. Forest Service and the Gallatin Valley Snowmobile Association.