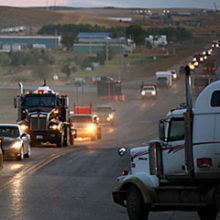
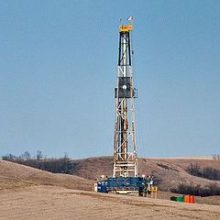
New Mexico’s fossil fuel energy industry, led by oil development, has made a strong recovery since the recession. The strength of crude oil prices relative to natural gas prices has driven a dramatic shift in drilling activity from natural gas to oil across the region and within New Mexico.
This report uses graphical analysis to offer a snapshot of New Mexico’s oil and natural gas industry, its direction, and implications for the state’s economy. The purpose of this report is to educate decision makers and the public about the current health of New Mexico’s oil and gas industry, the status of the clean energy sector, and how the state can better benefit from its energy industries.
Gas & Oil Prices | Drilling Activity | Regional Trends | Energy Industry | Clean Energy | Conclusions
Summary Findings
- The strength of crude oil prices relative to natural gas prices has driven a shift in drilling activity from natural gas to oil across the region and within New Mexico. As a result, New Mexico’s recent energy activity has been led by drilling for oil–86 of 90 active rigs are drilling for oil, all but a few in the Permian Basin.
- The production value of oil surpassed the production value of natural gas for the first time in April, 2010, and by March, 2012 was three times the value of natural gas: $682 million to $204 million.
- Unlike other states such as Colorado and Wyoming, New Mexico has rebounded strongly from recession lows; the June 15, 2012 weekly rig count (90) was about 90 percent of the highs (just more than 100) reached in 2006.
- New Mexico’s regional share of rig activity has been relatively steady, declining from 24 percent during 2005‐2008 to 19 percent today. (By comparison, Colorado and Wyoming saw the largest declines in drilling rig activity based on the two state’s relative strength in natural gas before the recession.)
- Even with increased oil activity, the oil and natural gas sector’s share of overall employment in New Mexico is relatively small–one percent in 2010. By comparison, health care services were roughly 11 percent of employment; professional, scientific, and technical services seven percent; and finance and insurance three percent of employment in 2010.
- Green jobs, of which renewable energy is an important part, accounted for 2.1 percent of all New Mexico employment in 2010. In the Albuquerque metro area in 2010 clean economy employment was 2.6 percent of all area jobs.
Price Gap Widens Between Natural Gas and Oil
High commodity prices for oil and natural gas combined with new horizontal drilling and hydraulic fracturing technology unlocked a boom in natural gas drilling activity in New Mexico and across the country during the first seven years of the 2000s. The national recession ended the boom with prices for both commodities crashing as demand fell, and as natural gas in particular was over supplied. As the U.S. slowly emerges from the recent recession, oil prices have recovered but natural gas prices have continued to decline (Figure 11).
Figure 1: U.S. Price Energy Equivalent of Crude Oil and Natural Gas*, January 2000 to March 2012
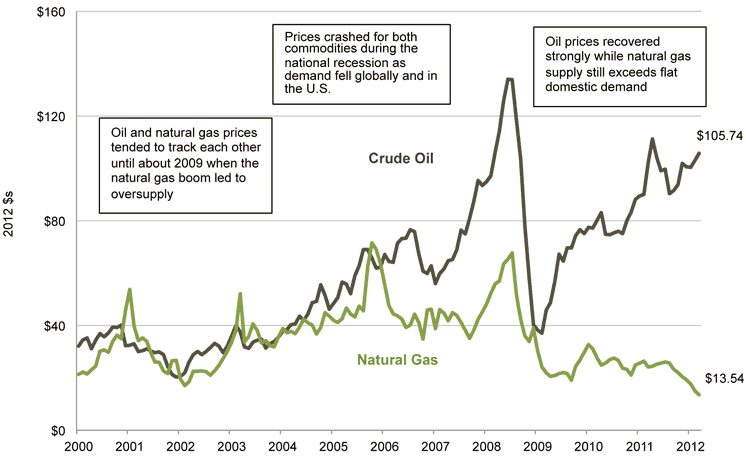
* The U.S. Geological Survey estimates that one barrel of oil is equivalent to six thousand cubic feet of gas.2 The figure compares the price of domestic crude oil to the oil equivalent price of natural gas by multiplying the wellhead price of domestic natural gas (dollars per thousand cubic feet or mcf) by six.
Widening Price Gap Shifts Drilling Activity from Natural Gas to Oil
Trends in drilling activity are important both as indicators of industry preferences for regions and resources, and because they serve as a good proxy for employment trends. Nationally, more than three-quarters of oil and gas employment, on average, is associated with drilling and exploration.3
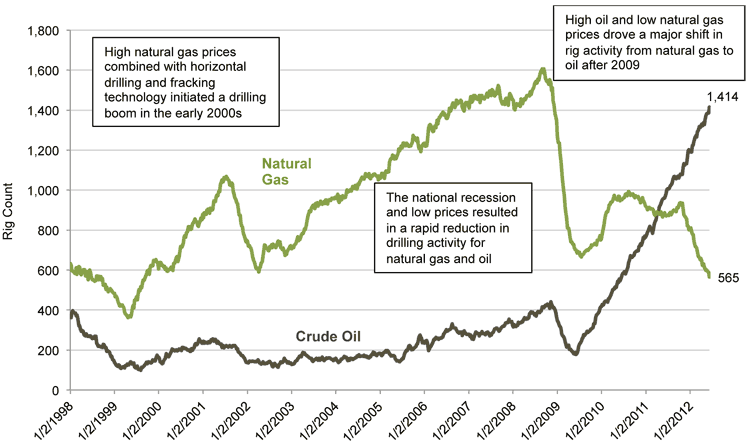
Price is the most important driver of industry investment decisions. Price volatility over the last decade led to booms and busts in drilling activity in oil and natural gas. More recently, the strength of crude oil prices relative to natural gas prices has driven a dramatic shift in drilling activity from natural gas to oil across the country (Figure 2) and within New Mexico. At the peak of the recent natural gas boom, about
2,000 drilling rigs were active in the U.S., four fifths of them drilling for natural gas. As of June 8, 2012, the ratio has nearly reversed with only 565 rigs drilling for natural gas, and 1,414 drilling for oil.
Figure 2: U.S. Rigs Drilling for Oil and Natural Gas, January 1998 to June 2012
New Mexico Oil and Natural Gas Activity on Par with Regional Trends
Drilling activity across six Western states–Colorado, Montana, New Mexico, North Dakota, Utah, and Wyoming (Figure 3)–have followed the same trends: the total rig count peaked at 426 in August, 2008, plummeted to 158 by June, 2009, and subsequently recovered to 465 by June, 2012.
The total number of rigs in the region is higher than before the recession, reflecting the oil boom in North Dakota. Excluding North Dakota, in the five Rocky Mountain States, rig counts peaked at 352 in August, 2008 and have recovered to 262 in June, 2012–at 74 percent of the pre‐recession total.4
Figure 3: Rig Count in Rocky Mountain States and North Dakota, Weekly, 1/3/1997 through 6/8/2012
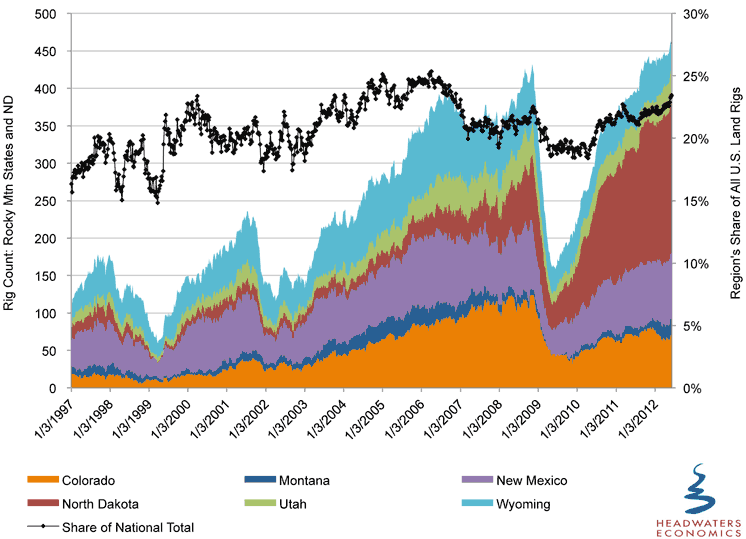
Unlike other states such as Colorado and Wyoming, New Mexico has rebounded strongly from recession lows; the June 15, 2012 weekly rig count (90) was about 90 percent of the highs (just over 100) reached in 2006.
Across a six‐state region (Figure 4), North Dakota captured 44 percent of rig activity in June, 2012, up from 11 percent of rig activity across the region before the national recession. The Bakken formation’s unconventional oil is the main target for the drilling rigs moving into the state. Rigs can move seamlessly between unconventional oil and natural gas resources where the same horizontal drilling and hydraulic fracturing technology is applied to extraction.
New Mexico’s share of rigs has been relatively stable compared to its regional energy‐producing peers. The state’s regional share of rig activity has declined from 24 percent during 2005‐2008 to 19 percent today. By comparison, Colorado and Wyoming saw the largest declines in drilling rig activity based on the two state’s relative strength in natural gas before the recession. Colorado fell from 27 percent of total rig activity in the region to 16 percent, while Wyoming fell more steeply from 23 percent of total rig activity in the region to eight percent.
Figure 4: State Share of Six‐State Weekly Rig Activity Before and After the National Recession
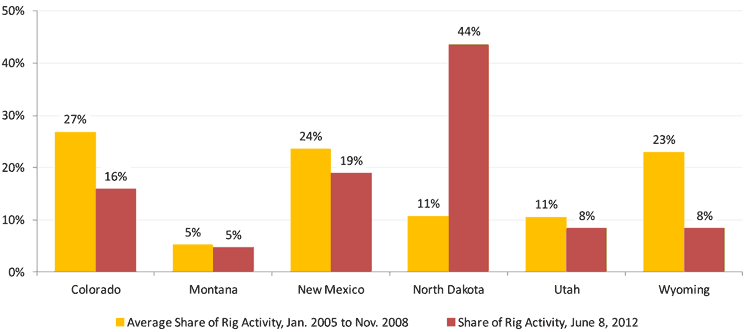
The pattern of rig distribution between the states reflects the relative strength of each in oil versus natural gas resources. New Mexico’s recent energy activity has been led by drilling for oil–86 of 90 active rigs are drilling for oil, all but a few in the Permian Basin. About 85 percent of today’s drilling activity in New Mexico targets oil and currently takes place in Eddy and Lea counties in the far southeastern part of the state.5
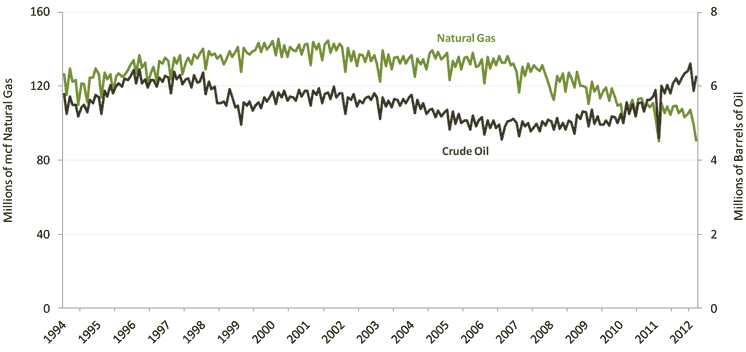
New Mexico’s natural gas production (Figure 5) has fallen at an accelerating rate from a peak of 145.6 million mcf in March, 2000 to 90 million mcf in March, 2012.6 Oil production also declined in the mid-2000s. Significant new horizontal drilling and hydraulic fracturing activity in the Permian Basin has reversed this decline. Oil production peaked at 6.5 million barrels in March, 1996, declined steadily to lows of about 4.7 million barrels monthly in 2006 and 2007, and rose to 6.6 million barrels monthly by January, 2012.7
Figure 5: New Mexico Monthly Production of Crude Oil and Natural Gas, January 1994 to March 2012
The production value of oil and natural gas in New Mexico (Figure 6) has been volatile. In April, 2010 the production value of oil surpassed the production value of natural gas for the first time in recent history, and by March, 2012 was three times the value of natural gas at $682 million compared to $204 million.8
Figure 6: New Mexico Monthly Production Value of Crude Oil and Natural Gas, January 1994 to March
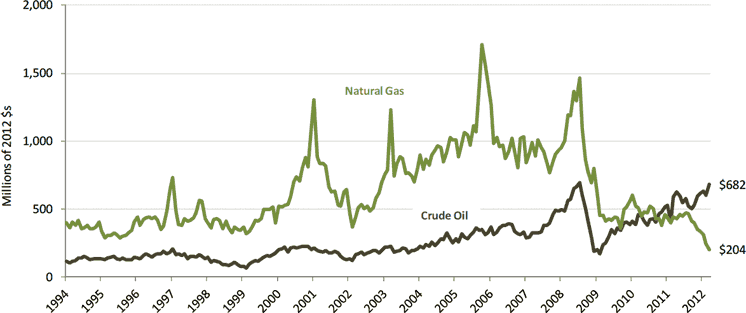
The production value of natural gas showed significant volatility, but increased overall through the first eight years of the 2000s. Production value peaked at over $1.7 billion for the month of November, 2006. As prices fell during the recent national recession, production value declined from $1.5 billion in July, 2008 to $364 million in September, 2009. By March, 2012, production value had declined even further to $204 million for the month.
By comparison, the production value of oil has increased since the end of the last recession. Production value rose leading up to the national recession, peaking at $693 million in July, 2008. It fell to $172 million in February, 2009 before recovering to $682 million in March, 2012.
Role of the Energy Industry in New Mexico’s Overall Economy
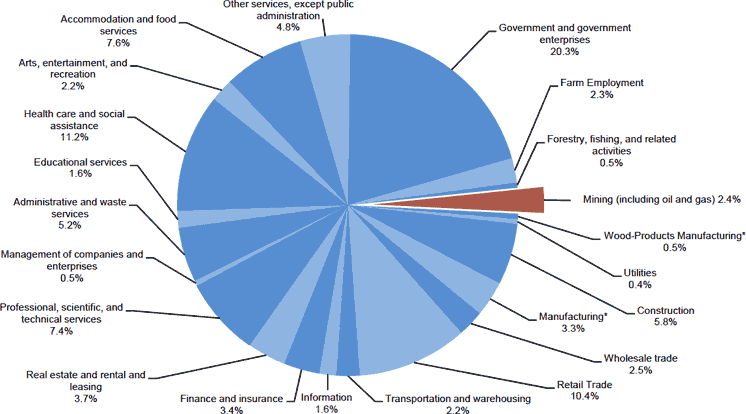
Mining’s share (including oil and natural gas) of overall employment in New Mexico is relatively small — about 2.4 percent in 2010, roughly 26,000 New Mexicans.9
By comparison (Figure 7), in 2010 health care services are roughly 11.2 percent of employment; professional, scientific, and technical services 7.4 percent; and finance and insurance 3.4 percent of employment. Combined, these three sectors employed 235,889 New Mexicans.10
Figure 7: Employment by Industry, Percent of Total, New Mexico 2010
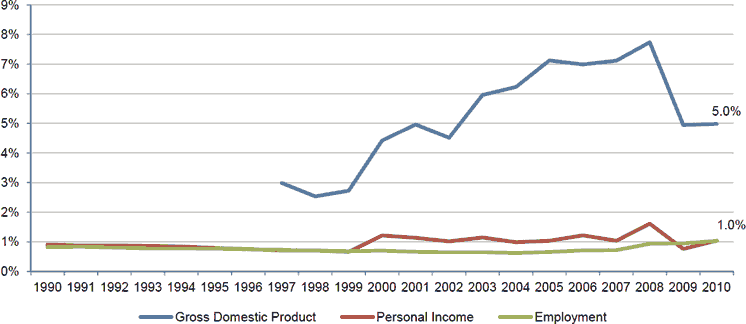
Looking at only oil and natural gas, these sectors (Figure8) in 2010 represented one percent of total state employment (10,985 jobs) and contributed to one percent of total state personal income.11 The oil and natural gas industry contributed five percent of total state gross domestic product in 2010, the latest year for which data are available.12This is nearly double from the late 1990s and shows the importance of price to overall production value.
Figure 8: New Mexico Employment, Personal Income, and Gross Domestic Product for the Oil and Natural Gas Industry, 1990 to 2010
Clean Energy Sector in New Mexico
A number of studies have found that the state’s renewable energy economy represents a bright spot of economic opportunity, and New Mexico’s renewable energy sector created green jobs faster than the state’s overall economy and faster than other Rocky Mountain States.13
Overall, “green jobs,” of which renewable energy is an important part, accounted for 2.1 percent of all New Mexico employment according to the Brookings Institution (about 17,725 jobs in 2010), and grew by six percent from 2003 to 2010. In the Albuquerque metro area, Brookings found 9,912 clean economy jobs in 2010, roughly 2.6 percent of all jobs, representing 7.8 percent growth from 2003 to 2010.14
The Headwaters Economics report from 2010, Clean Energy Leadership in the Rockies: Competitive Positioning in the Emerging Green Economy, compared Colorado, Montana, New Mexico, Utah, and Wyoming. That report showed that fifty percent of green enterprises in the study region were based in Colorado, followed by New Mexico and Utah (both at 16%), Montana (11%), and Wyoming (6%).
In late May of this year, the State Clean Energy Index ranked New Mexico eighth among states nationally. The rating system (which ranked New Mexico seventh in 2011), produced by Clean Edge, a clean‐tech analysis firm, reviews how states and the private sector compare and compete across the clean‐energy spectrum in measurements such as total electricity produced by clean‐energy sources, clean‐energy venture and patent activity, and policy regulations and incentives.15
The states with the highest rankings and strongest competitive position are those able to capture new energy opportunities–not only power generation facilities and manufacturing jobs, but investment and employment in the technologies, products, and services related to a growing worldwide demand for clean energy, conservation, and energy efficiency.
New Mexico’s success in this area shows the importance of government policy and guidance at all levels, from county commissioner to United States Senator. The state’s aggressive outreach program, backed by incentives–including property tax breaks, bonding, and worker training–has attracted new jobs and investment to the state.
New Mexico leads the region in growing green jobs, and the state’s green employment grew by 62 percent from 1995 to 2007, compared to a 13 percent rate for its overall employment. In comparison, nationally green jobs grew by 18 percent and overall employment was up 10 percent during the same time period.16
The state also did well attracting clean energy‐oriented venture capital, and saw private investments grow by $239 million between 1999 and 2008. New Mexico ranked 12thnationally in this sector from 2006‐2008, and the state leads the Rocky Mountain region in clean energy production.
There are several reasons for New Mexico’s leadership role:
Strategic Pairing of Incentives with Clear Policy Goals. New Mexico has strong clean energy and efficiency mandates. By comparison, Utah has failed to create certainty for the clean energy sector with its weak renewable mandate and fossil fuel‐focused energy development incentives.
Encouraging and Capturing Large‐Scale Investment. New Mexico, already a leader in attracting private investment, has taken advantage of its complete package of serious policies, incentives, and proven record to develop technological expertise and a skilled workforce.
Cultivating a Well‐Resourced Business Environment. New Mexico’s two national labs, combined with a growing high technology manufacturing base around Albuquerque, make the state a regional and national leader attractive to a variety of green economy businesses that require skilled workers and access to world class research institutions.
New Mexico may well continue to be a green economy leader. However, the state cannot take its position for granted. As the clean energy and energy efficiency sectors continue to grow, more and more states will join New Mexico in competing to attract the associated jobs, revenues, and investments.
Conclusions
New Mexico’s fossil fuel industry, led by oil development, made a strong recovery since the last recession. The strength of crude oil prices relative to natural gas prices has driven a shift in drilling activity from natural gas to oil across the region and within New Mexico.
New Mexico’s rebound has been led by drilling for oil–86 of 90 active rigs are drilling for oil, all but a few in the Permian Basin. About 85 percent of drilling activity in New Mexico targets oil and currently is taking place in Eddy and Lea counties in the far southeastern part of the state.
As a result of the shift from natural gas to oil development in New Mexico, the production value of oil surpassed the production value of natural gas for the first time in April, 2010, and by March, 2012 was three times the value of natural gas at $682 million compared to $204 million.
Compared to other states such as Colorado and Wyoming, New Mexico has rebounded strongly from recession lows; the June 15, 2012 weekly rig count (90) was about 90 percent of the highs (just over 100) reached in 2006. New Mexico’s regional share of rig activity declined from 24 percent during 2005‐2008 to 19 percent today. (Colorado and Wyoming saw the largest declines in drilling rig activity based on the two state’s relative strength in natural gas before the recession. Colorado fell from 27 percent of total rig activity in the region to 16 percent, while Wyoming fell more steeply from 23 percent of total rig activity in the region to eight percent.)
Overall, the oil and natural gas industry represents a small portion of total state jobs and personal income–one percent of overall employment in 2010, or roughly 10,985 New Mexicans. By comparison, health care services were roughly 11 percent of employment; professional, scientific, and technical services seven percent; and finance and insurance three percent of employment. Combined, these three sectors employed 235,889 New Mexicans.
The clean energy sector is a bright spot in New Mexico’s economy relative to most other states. It is still a relatively small share of New Mexico’s overall economy, accounting for 2.1 percent of all New Mexico employment in 2010 (about 17,725 jobs). In the Albuquerque metro area in 2010 there were 9,912 clean economy jobs, roughly 2.6 percent of all area jobs. The state maintains competitive advantages in clean energy and continued investments and commitments to renewable energy and other green economy sectors will help diversify the state’s energy industry.
Endnotes
- 1. Energy Information Administration, Monthly U.S. Crude Oil First Purchase Price by Area, Dollars per Barrel. 2011 http://www.eia.gov/totalenergy/data/annual/showtext.cfm?t=ptb0518; Monthly Natural Gas Wellhead Prices by Area (Dollars per Thousand Cubic Feet). 2011. http://www.eia.gov/dnav/ng/ng_pri_sum_dcu_nus_a.htm. ↑
- 2. U.S. Geological Survey World Petroleum Assessment 2000–Description and Results by USGS World Energy Assessment Team. Washington, D.C. Table AR‐1. World level summary of petroleum estimates for undiscovered conventional petroleum and reserve growth for oil, gas, and natural gas liquids (NGL). http://energy.cr.usgs.gov/WEcont/world/woutsum.pdf. ↑
- 3. Reporting U.S. data for 2008. U.S. Department of Commerce. 2010. Census Bureau, County Business Patterns. ↑
- 4. Rig count information from Baker Hughes, http://investor.shareholder.com/bhi/rig_counts/rc_index.cfm. ↑
- 5. Ibid. ↑
- 6. New Mexico Energy, Minerals and Natural Resources Department, Oil Conservation Division. Statistics. Statewide Natural Gas and Oil Production Summary by Month. http://www.emnrd.state.nm.us/ocd/Statistics.htm. ↑
- 7. Ibid. ↑
- 8. Production value is volume multiplied by price. For example, the production value of 100 barrels of oil (volume) extracted at $90 per barrel (price) is $9,000. Production value of oil is calculated using production and price data from the Energy Information Administration: crude oil monthly production by area and crude oil first purchaser price. Price is adjusted using monthly CPI data from U.S. Department of Labor, Bureau of Labor Statistics, Washington, D.C. Consumer Price Index All Urban Consumers (CPI‐U) U.S. City Average, All Items 1982=100. ftp://ftp.bls.gov/pub/special.requests/cpi/cpiai.txt. Natural gas production data is from EIA, Natural Gas Monthly Production by Area up to December 2009. From January 2010 to March 2012, production data is from New Mexico Energy Minerals and Natural Resources Department, Oil Conservation Division. Natural gas price is from EIA: U.S. Monthly Natural Gas Wellhead Price, Dollars per Thousand Cubic Feet. ↑
- 9. U.S. Department of Commerce. 2012. Bureau of Economic Analysis, Regional Economic Information System, Washington, D.C. Table SA25N. ↑
- 10. U.S. Department of Commerce. 2012. Bureau of Economic Analysis, Regional Economic Information System, Washington, D.C. Table CA25N. ↑
- 11. U.S. Department of Commerce. 2012. Bureau of Economic Analysis, Regional Economic Information System, Washington, D.C. Tables SA05N & SA25N. ↑
- 12. U.S. Department of Commerce. 2012. Bureau of Economic Analysis. Gross Domestic Product by State. ↑
- 13. Headwaters Economics. 2010. Clean Energy Leadership in the Rockies: Competitive Positioning in the Emerging Green Economy, Bozeman, MT. This report compares how Colorado, Montana, New Mexico, Utah, and Wyoming are taking advantage of clean energy opportunities and five keys for future growth. ↑
- 14. Muro, M., et. al. 2011. Sizing The Clean Economy: A National And Regional Green Jobs Assessment. Brookings Institution. ↑
- 15. Clean Edge. 2012. “State Clean Energy Index.” ↑
- 16. Clean Energy Leadership. ↑
