National drilling rig counts are an important measure of trends in domestic fossil fuel energy development activity. Because a majority of oil and gas industry jobs are associated with the drilling phase, drilling activity (as measured by rig counts) serves as a good proxy for employment trends.
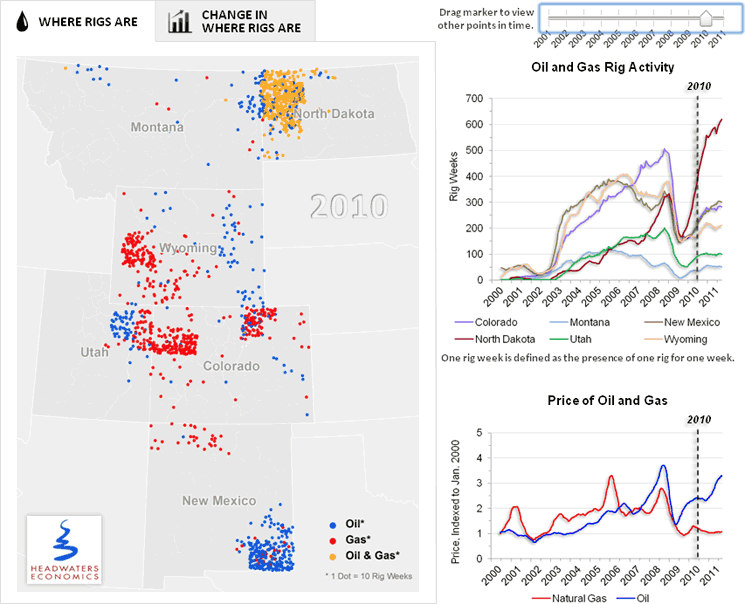
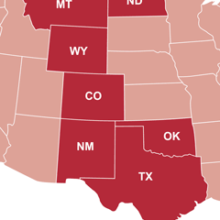
State-level information can obscure the intensity of oil and gas development activities in specific locations. For that reason, this report focuses on county-level details of drilling rig activity for the period 2001 to 2011 in the six Rocky Mountain oil and gas states of Colorado, Montana, New Mexico, North Dakota, Utah, and Wyoming. The unit of measure is rig weeks — the presence of one drilling rig for at least one week in the county.
This analysis and accompanying web-based interactive illustrate the amount of drilling activity at the county level both by year and the extent of changes from year to year: “Oil and Gas Drilling: Rig Weeks Activity 2001–2011”.
We also analyze three important dynamics in the boom-bust cycle that energy-focusing counties experience; identifying the 10 busiest counties, the 10 counties with the fastest buildups (booms), and the 10 counties with the steepest declines (busts). These county-level trends provide an opportunity to compare trends and the relative impacts of different boom-bust cycles in different geological areas.
Rig Activity | Busiest Counties | Fastest Build-Ups | Steepest Declines | By Basin | Conclusions
Summary Findings
- The pace and scale with which the industry moves often has significant impacts at the local level, with the majority of boom and bust activity confined to a handful of dramatically affected counties.
- Price is the most important driver of industry investment decisions. The strength of oil prices and low prices for natural gas explain why oil drilling has helped lead a recovery of drilling activity.
- Development occurs when and where resources are prime, a factor primarily determined by technological change.
- In 2011, rig activity in the Rocky Mountain states and western North Dakota, exceeded the heights reached during the natural gas boom of the 2000s.
Note: In June 2011, Headwaters Economics released a graphical analysis of oil and gas drilling activity that focused on trends at the state and national levels: “Drilling Rig Activity Nears 20-Year High”.
Rig Activity Trends
The oil and gas industry can respond to market signals with tremendous agility, in part because of ongoing investment in exploring new resource areas. The key message conveyed by the maps and data shown here is that the dramatic pace and scale with which the industry moves register at a very local level, with the majority of boom and bust activity confined to a handful of dramatically affected counties.

Visit interactive display of changing “Rig Activity from 2001–2011”
Busiest Counties
As measured by total rig weeks in a single county over the course of a calendar year, Garfield County, Colorado and Sublette County, Wyoming hit all time highsas the busiest drilling areas in the West in the years 2008 and 2006, respectively. The next busiest counties were Eddy County, New Mexico in 2006, and McKenzie and Mountrail counties, North Dakota in 2011.
10 Busiest Counties — Most Rig Activity in a Single Year in the Past Decade
|
County, State |
Basin |
Rig Weeks in a Single Year |
Year
|
| 1 |
Garfield County, CO |
Uinta-Piceance |
3181 |
2008 |
| 2 |
Sublette County, WY |
Green River |
2257 |
2006 |
| 3 |
Eddy County, NM |
Permian |
2041 |
2006 |
| 4 |
McKenzie County, ND |
Williston |
1882 |
2011 |
| 5 |
Mountrail County, ND |
Williston |
1633 |
2010 |
| 6 |
Weld County, CO |
Denver |
1602 |
2011 |
| 7 |
Lea County, NM |
Permian |
1564 |
2005
|
| 8 |
Uintah County, UT |
Uinta-Piceance |
1458 |
2008 |
| 9 |
Williams County, ND |
Williston |
1352 |
2011 |
| 10 |
Dunn County, ND |
Williston |
1169 |
2011 |
Fastest Build-Ups
We often pay attention when a boom is underway, but are less cognizant of the period of build up and bust.Focusing on the boom makes sense because local impacts may be most visible. But the speed and scope of change that occurs during the build up to a boom make these periods equally dramatic — often leading to the most difficult periods for local economies and governments that are challenged to react to rapid swings in revenue, population, and business activity.
For the period 2001 to 2011, the largest year-to-year increase in rig activity in a single county took place between 2002 to 2003 in Eddy County, New Mexico. The second largest boom in year-to-year activity occurred in Mountrail County, North Dakota between 2007 and 2008.
10 Fastest Build-ups in Oil and Gas Drilling Activity in the Past Decade
|
County |
Basin |
Total Increase in Rig Week Activity |
Period |
| 1 |
Eddy County, NM |
Permian |
1154 |
2002-2003 |
| 2 |
Mountrail County, ND |
Williston |
858 |
2007-2008 |
| 3 |
Lea County, NM |
Permian |
834 |
2002-2003 |
| 4 |
Williams County, ND |
Williston |
815 |
2009-2010 |
| 5 |
Garfield County, CO |
Uinta-Piceance |
808 |
2002-2003 |
| 6 |
McKenzie County, ND |
Williston |
763 |
2009-2010 |
| 7 |
Sublette County, WY |
Green River |
725 |
2002-2003 |
| 8 |
Weld County, CO |
Denver |
622 |
2010-2011 |
| 9 |
Uintah County, UT |
Uinta-Piceance |
495 |
2003-2004 |
| 10 |
Dunn County, ND |
Williston |
413 |
2009-2010 |
Steepest Declines
The recession led to declines in drilling activity throughout the region, but some areas experienced especially steep losses. The 2008-2009 bust was led by Garfield County, Colorado which lost more than twice the volume of rig activity-2100 rig weeks-than the runner-up “loser,” Uinta County, Utah, also in 2008-2009.
10 Steepest Falls in Oil and Gas Drilling Activity in the Past Decade
| |
County |
Basin |
Total Change in Rig Week Activity |
Period |
| 1 |
Garfield County, CO |
Uinta-Piceance |
-2100 |
2008-2009 |
| 2 |
Uintah County, UT |
Uinta-Piceance |
-1007 |
2008-2009 |
| 3 |
Sublette County, WY |
Green River |
-915 |
2008-2009 |
| 4 |
Eddy County, NM |
Permian |
-663 |
2008-2009 |
| 5 |
Lea County, NM |
Permian |
-588 |
2008-2009 |
| 6 |
Mesa County, CO |
Uinta-Piceance |
-449 |
2008-2009 |
| 7 |
Weld County, CO |
Denver |
-390 |
2008-2009 |
| 8 |
Sweetwater County, WY |
Green River |
-368 |
2008-2009 |
| 9 |
Richland County, ND |
Williston |
-355 |
2008-2009 |
| 10 |
Rio Blanco County, CO |
Uinta-Piceance |
-234 |
2008-2009 |
Rig Activity by Basin
The activity levels described in the tables above also provide an opportunity to compare county-level impacts of boom-bust cycles in different basins: Uinta-Piceance, Permian, and Bakken.
For example, counties in the Uinta-Piceance Basin led the rankings for busiest year of drilling activity in 2008 (during the period 2001 to 2011) with 5,263 total rig weeks taking place in three counties in the Uinta-Piceance Basin: Garfield County, Colorado (3,181), Rio Blanco County, Colorado (624);and Uintah County, Utah (1,458).
Despite the scale of the natural gas activity in Utah and Colorado in 2008, the pace of the build up (over a single year) in the Permian Basin in Southeastern New Mexico in 2002-2003 was actually greater.
In 2011, drilling in North Dakota exceeded the most recent previous surge (reached in the Utah- Colorado natural gas boom). County activity levels for 2011 were as follows: McKenzie (1,882); Mountrail (1,427); Williams (1,352); Dunn (1169); and Divide (366) — totaling 6,196 rig weeks for these five counties.
Conclusion
Oil and gas extractive activities track market activity closely. Development occurs when and where resources are prime, which is a function of both technology and price. These variables can lead to rapid changes in the pace, scale,and location of development. Counties experience these rapid changes as booms and busts that bring swift accelerations and decelerations in population growth, employment, and revenue.


