
About Populations at Risk
Customize and download reports about U.S. populations more likely to experience adverse social, health, or economic outcomes due to race, age, gender, poverty status, or other factors. Reports can be generated for census tracts, counties, or states.
Understanding the location and extent of populations at risk can be critical to community decision-making.
The Populations at Risk tool generates customized socioeconomic reports about populations more likely to experience adverse social, health, or economic outcomes due to race, age, gender, poverty status, or other factors. A web-based tool designed for the general public, Populations at Risk is free and easy to use.
Reports can be generated for U.S. communities, census tracts, counties, states, congressional districts, Indian Country, and metro and rural portions of states. Forty years of data provide context and reveal trends. Several geographical areas can be selected to aggregate or compare data. Reports can be downloaded as Excel or .pdf files.
Populations at Risk reports are based on the U.S. Census Bureau’s American Community Survey. Data are updated annually.
Populations at Risk was developed with funding from the Bureau of Land Management, USDA Forest Service, and the Kresge Foundation.
Frequently Asked Questions
What is Populations at Risk?
Populations at Risk is a tool to generate reports with socioeconomic information about populations more likely to experience adverse social, health, or economic outcomes due to their race, age, gender, poverty status, or other factors.
View a sample report (PDF).
What type of data are in Populations at Risk reports?
The reports use the Census’ American Community Survey (ACS) to provide social, health, and economic data along with race, age, gender, poverty, and other socioeconomic measures.
What geographies are included in Populations at Risk reports?
The reports are available for nine levels of geography ranging from Census tracts to states. The specific geographic levels are:
- Census tracts
- Census designated places (communities)
- American Indian and native areas
- County subdivisions
- Counties
- Congressional districts
- Combined statistical areas
- Metro and rural portions of states
- States
How much does it cost to use PAR?
Populations at Risk is free to use. With the help of our partners, the BLM, US Forest Service, and Kresge Foundation, Headwaters Economics developed Populations at Risk to improve public access to high-quality data about our more vulnerable citizens.
How often is PAR updated?
Populations at Risk displays data from the Census’ American Community Survey (ACS), which is released annually in December. The latest available numbers are reflected in PAR reports within a maximum of 90 days after publication by the Census.
How should I cite data from Populations at Risk reports?
Headwaters Economics recommends that you cite data from Populations at Risk reports using the citation provided at the bottom of each Data and Graphics page within the report. For example:
U.S. Department of Commerce. 2013. Census Bureau, American Community Survey Office, Washington, D.C., reported by Headwaters Economics’ Populations at Risk, https://headwaterseconomics.org/par.
Help using Populations at Risk
How to generate and download a report
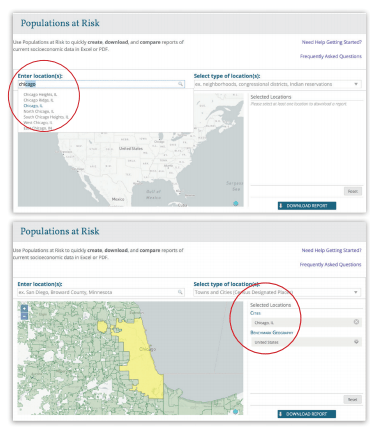
Enter name of location in “Enter location(s):” field
Click the desired location from dropdown menu.
Location is added to “Selected Locations” list.
(for example: Chicago, Cook County, or Illinois)
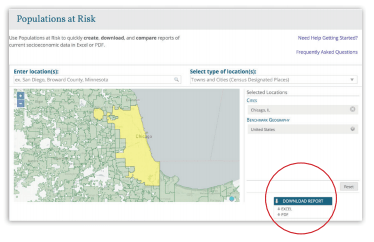
Click the “Download report” button and choose PDF or Excel format.
The Populations at Risk tool will generate a report for you.
Check your download folder if report does not automatically appear.
Congratulations! You have successfully generated and downloaded a report.
Customize your report
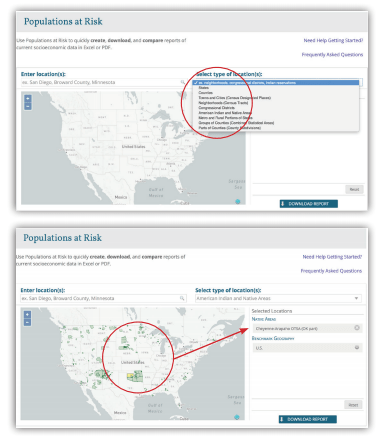
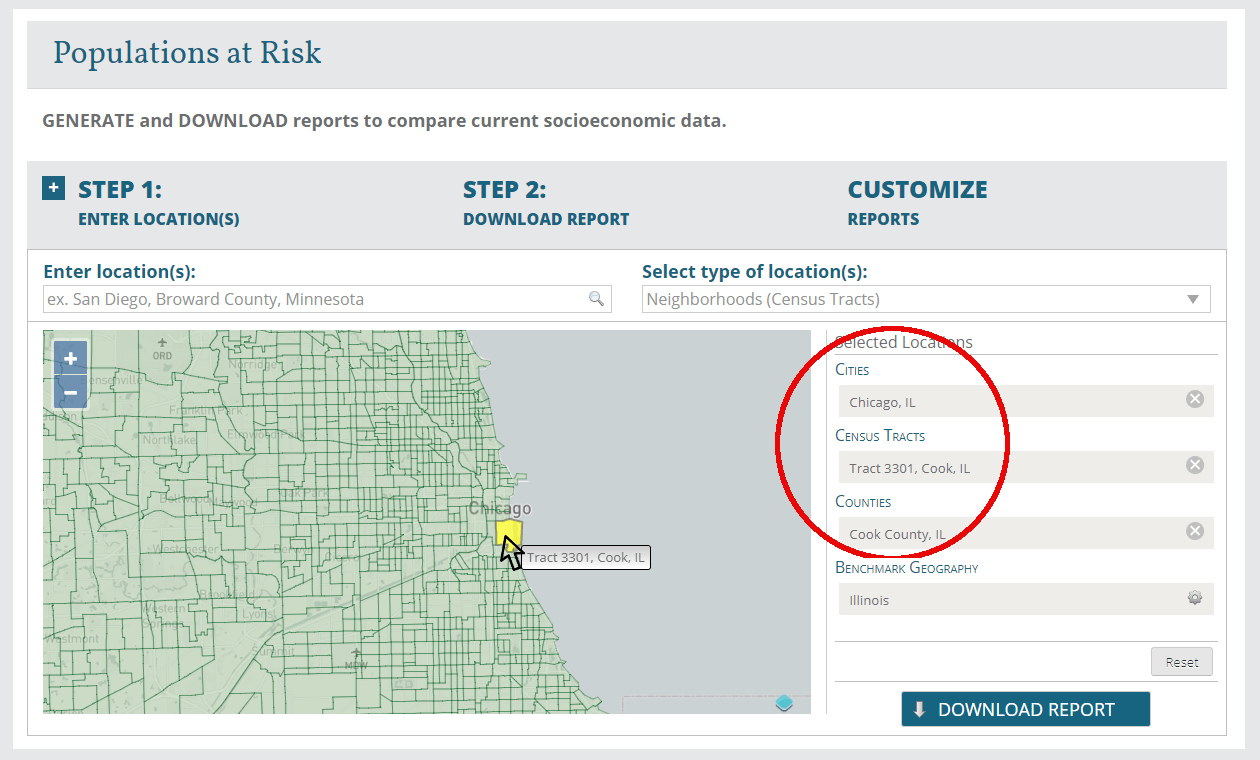
Search locations by type instead of name.
Click “Select type of location(s):” drop down menu and choose desired type.
(For example: Select “American Indian and Native Areas” from dropdown menu. Map will populate with all American Indian and Native Areas. Click on geography in map to select desired area. Follow Step 2 above to download a new report.)
Comparing multiple locations.
Enter additional locations in “Enter Location(s):” field or types in “Select type of location(s):”
Each location added to the “Selected Locations” list will appear in your report.
(Follow Step 2 above to download a new report.)
Change Benchmark Geography.
The Populations at Risk tool uses the entire United States (U.S.) as its Benchmark Geography.
You can easily change the Benchmark Geography by clicking the settings (gear) icon.
(Follow STEP 2 above to download a new report.)
Congratulations! You have successfully generated and downloaded a customized report.
Additional user tips
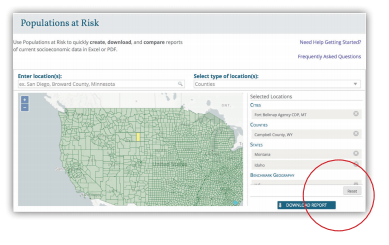
Use the “Reset” button to start over.
If you have selected too many locations or want to start over, click “Reset” button.
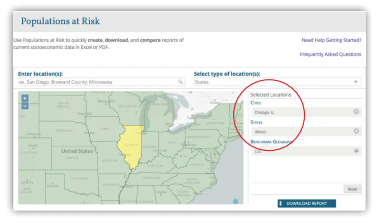
Compare different size communities.
The Populations at Risk tool can compare different size communities across the United States in two ways.
- After selecting one location (for example, Illinois) a user can then enter a differently-sized community in the “Enter Location(s):” field.
- Or, users can click “Select type of location(s):” drop down menu to choose the desired type of community. Once selected, the map will populate at that scale, and users can click the desired geographies on the map to add location(s) to the “Selected Locations” list.
(Follow STEP 2 above to download a new report.)