Changing climate will affect the timber industry, tourism, and demands on health care services
This web post briefly summarizes the Climate Adaptation Report which provides a description of key economic sectors at greatest risk from extreme weather or long-term climate shifts and is intended to prepare the region’s forests, water resources, and communities for a less certain future.
The project was done in partnership with the Superior Watershed Partnership, Climate Solutions University, Pictured Rocks National Lakeshore, U.S. Forest Service, Great Lakes Integrated Science Assessments, and the Great Lakes and St. Lawrence Cities Initiative.
Climate Changes and Impacts
Scientists for the Intergovernmental Panel on Climate Change (IPCC) have concluded that climate change due to the burning of fossil fuels is occurring, with a variety of results that can be measured and documented.1 The global average surface temperature has risen 1.4° F in the last 100 years, and the rate of warming has doubled from the previous century. Around the world, glaciers are melting, polar arctic ice is disappearing, sea level is rising, and extreme weather events now linked to climate change are increasing in frequency and intensity. Animals have been shifting their ranges pole-ward on all continents and significant changes in algal, plankton, and fish abundance in high-latitude oceans have been observed.2
Temperatures have also increased significantly in the Upper Peninsula UP. Temperature data collected in Munising, MI since 1900 shows that the 2000s were the hottest decade, with temperatures rising 2.7° F over the historical average of the previous century. The 1990s were the second hottest decade, and the 1980s were the third hottest.3 Summer temperatures in the Great Lakes region are projected to rise by between 5° F and 20° F by 2100. Already, temperatures in the region have warmed by almost 4° F in the 20th century—much faster than the global average.4 Warmer and drier summers are causing drought conditions, which stress forest and agricultural resources and will result in greater fire danger in the future—currently rare in the UP’s cool, moist woodlands. The summer of 2011 was one of the driest in Upper Peninsula history, with some areas reporting record drought.5
Winter temperatures have also increased, resulting in a shorter winter season and fewer days with snow on the ground. While annual snowfall totals have been slowly increasing in the Superior Watershed region over the past couple of decades, predictions are for snow to melt more quickly and remain on the ground for shorter durations—a phenomenon already being noticed in parts of the UP for the past few years.
The effects, both psychological and economic, of the decline of snow cannot be overstated; “snow culture” is one of the defining characteristics of life in the Upper Peninsula. Its loss would have a profound impact on quality of life, winter tourism, and local economics. Studies show that spring is arriving earlier each year and that plant hardiness zones are moving north. At least 15 bird species have advanced their spring arrival dates by one to eight weeks.6 Animals such as cardinals, turkeys, opossum and mourning doves have migrated northward to the Upper Peninsula as winters have become milder. Certain trees species, such as Sugar Maple and Aspen, are already showing the effects of stress due to drought conditions that may be linked to climate change. Local residents have noticed more intense storm events in recent years, which scientists recently have been (cautiously, but with increasing confidence) connecting with climate change.
The Great Lakes Integrated Science & Assessment (GLISA) provides accessible information about the climate change issues facing the Great Lakes region. The website includes materials that provide valuable background information for those considering Great Lakes climate.
The Timber Economy
The timber industry employs 1,848 people directly, not including about 240 proprietors. In total, the industry accounted for four percent of all jobs in the nine Lake Superior Watershed counties in 2009.7 Job losses in the industry are likely coming from three points: mechanization including technology advancements in harvesting; the national housing slump and reduced demand for timber; and oversupply in the pulp and paper industry. Technology will continue to have an impact on job creation and skill requirements regardless of changes in price and demand for timber. However, the industry shows considerable stability and capacity despite the impacts of the national recession, and will likely remain an important sector of the economy in the future.
Map 1: Percent of Jobs in Timber and Wood Products
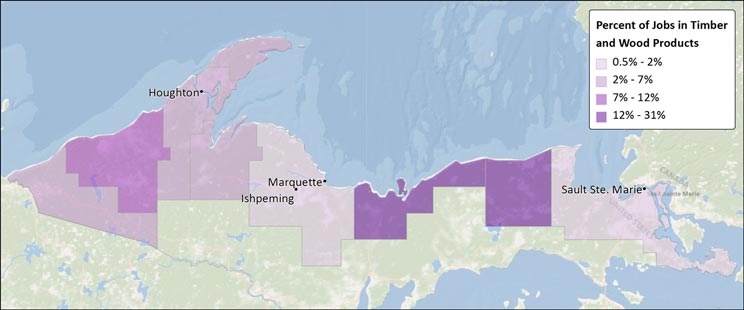
Alger and Luce counties will be disproportionately affected by potential new costs and further job losses. Alger County had 31 percent of all jobs in the timber industry in 2009, and in Luce county 17 percent of jobs were in timber in the same year. By comparison, only four percent of all jobs in the region are in timber. Houghton (3%), Keweenaw (2%), Marquette (1%), and Chippewa (<1%) counties have relatively few jobs in timber and will be less affected by potential impacts.
Figure 1: Percent of Jobs in Timber and Wood Products in 20098

Figure 2: Jobs in Timber and Wood Products, 1998-20099
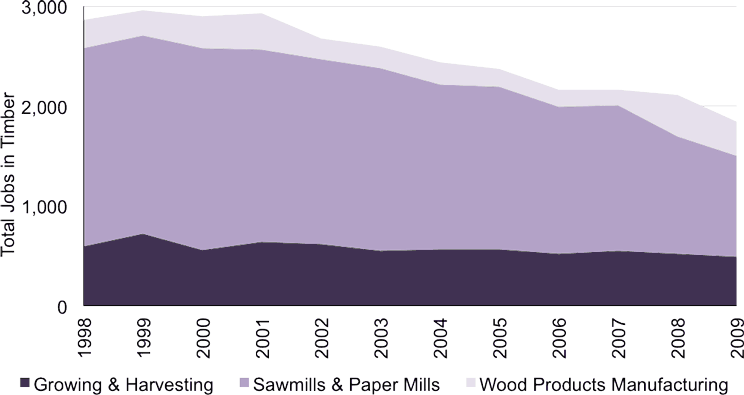
Threats to the timber industry include an increase in invasive pests, changes to forest tree composition due to shifting temperature ranges, extended drought, soil erosion due to flooding, increased fire risk and acute damage to infrastructure and forests from more frequent and more intense storms. These new challenges will further stress an industry that has lost more than 1,000 jobs over the last decade.
A study conducted by the University of Maryland, Center for Integrative Environmental Research also suggested the timber industry could suffer large economic impacts. The main climate-related impacts include a shift in the range of forest tree species northward and greater damage from tree pests and disease10—for example, the emerald ash borer, gypsy moth, and beech bark disease. Today, the dominant species that seem most important to the industry are the pines, aspens and maples.
The role of public forest lands is important to the timber industry in the region. The Forest Service manages 1.17 million acres in the nine counties, about 18 percent of the total land area, and the State of Michigan manages 1.14 million acres, about 17 percent of the land area.11 Average federal wages of $54,262 are higher than total private average wages of $32,879.12 Federal jobs are 1.4 percent of total employment but 2.5 percent of total personal income from labor sources.13 Commercial harvests have declined in recent years, but still accounted for more than 70,000 mbf from the Hiawatha and Ottawa National Forests with a cut value of more than $5 million in 2010.14 In addition to Federal lands, State lands contribute the largest share of timber harvests in the UP.
Forest restoration across the region is a growing opportunity for the industry. For example, the Great Lakes Restoration Initiative is investing significant funding in several areas related to forestry, including combating invasive species and restoring forested watershed to provide clean water and wildlife habitat that are important economic advantages for the Upper Peninsula. The Forest Service’s new Planning Rule may also provide new opportunities. For example, the emphasis on watershed restoration through the Watershed Condition Framework will create new focus on restoration activities.15
Supporting value-added opportunities utilizing restoration products, including woody biomass energy and small diameter products, will provide additional funding for restoration activities, and diversify contracting opportunities for local operators, utilizing the skills and capacity of the industry.
Travel and Tourism
The UP’s reputation as the “Snow Capital of the Midwest” is an economic asset that could be challenged by climate change. Winter recreation based on consistent deep snow and lake ice is sensitive to warming temperatures, less predictable snowpack, and declining ice cover on Lake Superior. Lake Superior moderates winter air temperature over much of the UP and therefore bitter cold is rare. The moderating effect also means that if temperatures go up even slightly, snow will change to rain and create poor conditions for winter recreation.
Many communities rely on income from winter festivals that include snowmobile, nordic and alpine ski events, and dogsled races. In February 2011, the celebrated UP 200, a dogsled race that serves as a qualifier for the Iditarod, was cut short in Alger County due to lack of snow and poor conditions, costing businesses tourism income. In February 2012, poor snow conditions again altered this event. The annual February Michigan Ice Festival in Munising took place with temperatures above freezing, and attendance at the event was down from the previous year.
Map 2: Percent of Jobs in Industries that Include Travel and Tourism, 2009
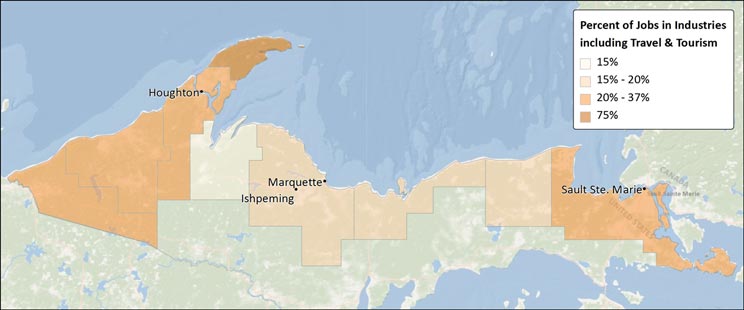
Winter recreation is most important to Gogebic and Ontonagon counties. Winter recreation is important, but balanced with summer tourism opportunities in Marquette, Baraga, Houghton, and Alger Counties. Summer tourism-dependent communities are mainly in Keweenaw, Luce, and Chippewa Counties.
Figure 3 shows jobs in economic sectors that provide goods and services to visitors to the local economy, as well as to the local population. It is not known, without additional research such as surveys, what exact proportion of the jobs in these sectors is attributable to expenditures by visitors, including business and pleasure travelers, versus by local residents. Some researchers refer to these sectors as “tourism-sensitive.” They could also be called “travel and tourism-potential sectors” because they have the potential of being influenced by expenditures by non-locals. Here, they are referred to as “industries that include travel and tourism.”
Figure 3: Percent of Jobs in Industries that include Travel and Tourism, 200916

Figure 4: Jobs in Industries that include Travel and Tourism, 1998-2009
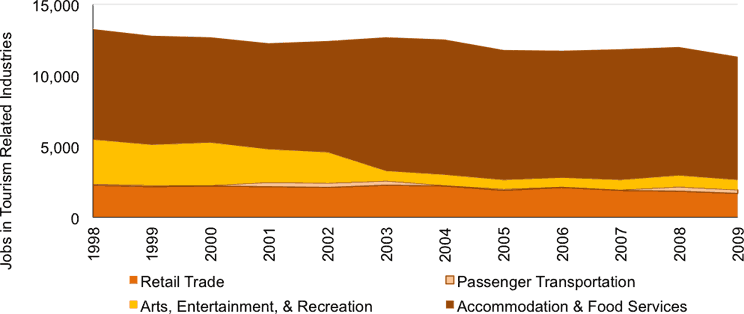
These data are useful for explaining whether sectors that are likely to be associated with travel or tourism exist, and as a result, which counties may be most sensitive to climate change that affects tourism-related industries. While the share of the sectors shown here that corresponds to travel and tourism activities will vary between geographies, it is useful to point out that in five of the nine Lake Superior Watershed counties, industries including travel and tourism make up more than 20 percent of total employment. From 1998 to 2009, these industry sectors lost about 2,000 jobs, falling from 13,286 to 11,328 jobs, a 14.7% decrease.
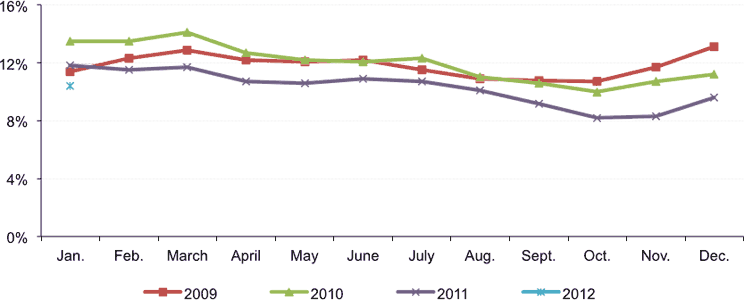
Seasonal unemployment is another indication of an economy dependent on travel and tourism. The unemployment rate is high to begin with, with seasonal unemployment peaking in the winter months, December to March and falling to the lowest point in the fall (September to November).
Figure 5: Seasonal Unemployment in the Lake Superior Watershed region, 2009-2012
Snowmobiling, a large part of the winter economy in watershed communities, has been down for the past few years due in part to poor snow and better conditions further south in Michigan. If this trend continues, winter tourism may increasingly turn to more silent sports (cross-country ski and snowshoe) enterprises. This could open up opportunities for more businesses—such as hut-to-hut skiing, snowshoe festivals or others—and continue to support related activities tourists enjoy when they visit, including movie and museum visits.
Summer tourism, already increasing, may experience a boom if temperature increases are moderate and the UP enjoys long periods of pleasant summer conditions. The experience of “years without a summer” may come to an end as the climate along Lake Superior loses its “cool summer” reputation, and more boaters, swimmers and campers head to the area for their vacations. Travel Michigan indicates boaters don’t for the most part travel with boats in tow so may not be relevant or may shift to comment on how this may open up more business opportunities for rentals or tours. Increased summer tourism will create a demand for more hotel/motel/property rental space, as well as opportunities for outdoor recreation supplies and services. The ability to meet the needs and expectations of visitors will be crucial to continued economic success.
Aside from tourism, prospects in climate adaptation-based job growth (such as green technologies, alternative energy, infrastructure needs, building energy efficiency, new products and services, etc.) may prove beneficial to communities struggling with increasing unemployment and declining population. At the same time, municipalities will need to create support services for people who lose their jobs due to climate change, such as businesses affected by a reduced winter tourism season.
Climate-related challenges to the tourism industry in summer may include heat waves and high humidity that can inhibit visitation, as there is a certain point when it is too hot and uncomfortable for people to enjoy outdoor recreation. Campers and hikers will need to be prepared for a longer biting fly and mosquito season. The Great Lakes may also experience increased and extended periods of poor water quality and algal blooms associated with warming temperatures that have public health effects resulting in restricted access to beaches. Storms and winds may bring down trees, blocking access to popular hiking trails and waterfalls, which happened several times at Pictured Rocks National Lakeshore during the summer of 2011.
Michigan State University’s recent Michigan Tourism Year-in-Review and Outlook profiles the industry, and includes a discussion of the potential impact of extreme weather on tourism.17
In addition to tourism, the quality of life the region offers can attract families and businesses to the region. The role of the region’s two National Parks and other public lands in economic development is also important. Research shows that people are drawn to areas for their quality of life and natural amenities, bringing investment income and business connections to the larger world. For example, across the Western U.S., protected federal lands such as national parks, monuments, and wilderness areas are associated with higher rates of job growth, particularly in services industries that represent that majority of new job growth in the region and across the country.18 In the Upper Peninsula, clean water, forest restoration, and public lands provide the basis for economic growth.
Rural Health Care and Vulnerable Populations
Human health concerns and quality of life are important drivers of rural economic development opportunities and public costs. Climate change will have impacts including heat-related deaths, a growing need for emergency services during extreme weather events, air quality concerns from more frequent forest fires, and the spread of vector-borne illnesses, such as West Nile Virus and Lyme disease.
Vulnerable populations, including people and families living below the poverty line, and the growing elderly population will be disproportionately affected. Retiring baby boomers will bring opportunity and new challenges for rural health care providers.
Map 3: Percent of Jobs in Health Care, 2009
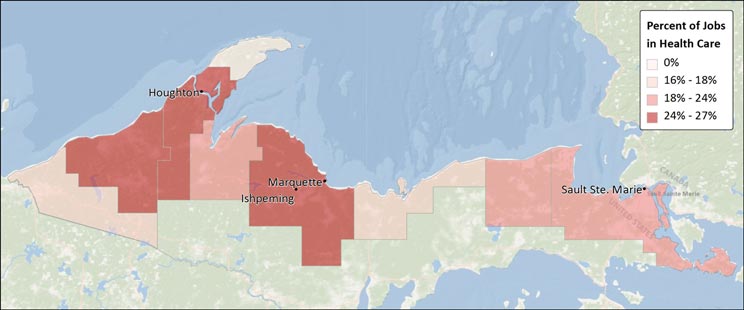
Figure 6: Percent of Jobs in Health Care Industries, 200919

Health care is among the largest industry sectors in the UP region, contributing 24 percent of employment (11,750 jobs).20 Every county but Keweenaw has at least 17 percent of jobs in health care, with Marquette having the highest proportion at 27 percent. Health care is also one of the few industries growing quickly in the region, adding 1,230 jobs from 2001 to 2009.
Figure 7: Jobs in Health Care Industries, 2001-200921
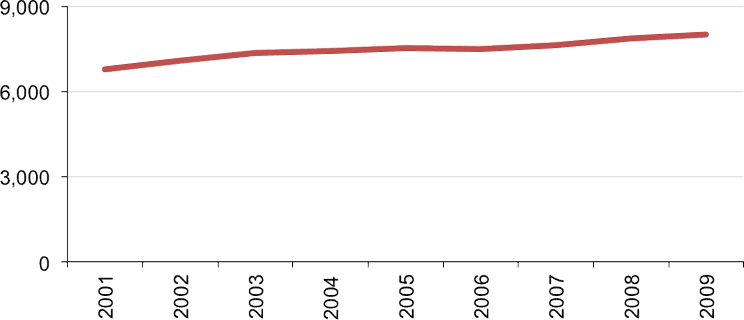
Figure 8: Median Age, Change from 2000-201022

Figure 9: Age Distribution and Change, 2000-201023
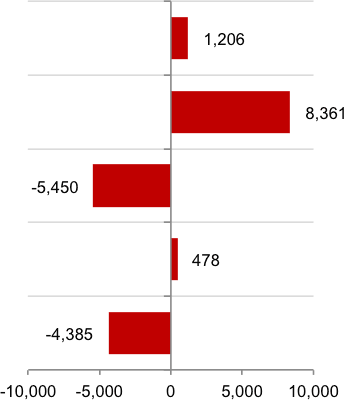
The population of the nine Lake Superior Watershed counties is stable, growing by only 210 people between 2000 and 2010, a 0.1 percent change. However, the average age increased across every county except Houghton. Population growth in the 45 to 64-year-old cohort is consistent with migration among baby boomers who are looking to retire in rural areas with high quality of life and scenic beauty.24 Baby boomers will bring income and often business opportunities, adding to economic development in rural areas. However, they will also demand quality health care services and place new demand on existing services.
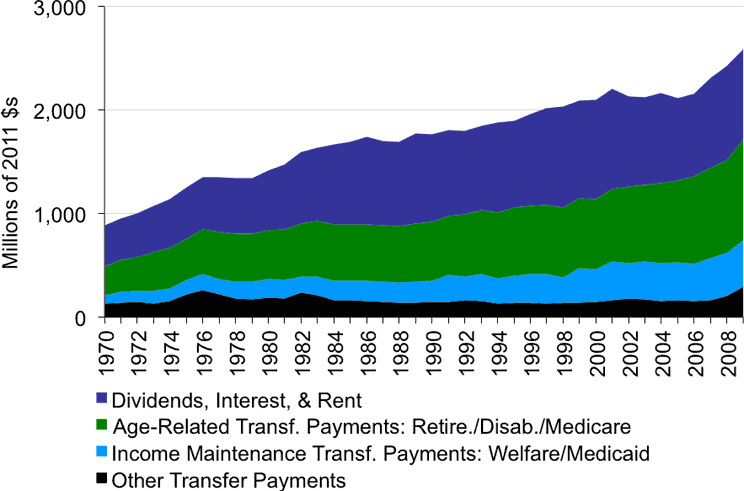
Non-labor income is also rising, making up nearly half of all income in the nine-county region. The portion of non-labor income from private investments has remained relatively flat over the last 20 years while transfer payments including retirement, medical, and unemployment payments have grown. The increasing importance of non-labor income is both a reflection of retirement income and payments, and growing medical and unemployment payments.
Figure 10: Components of Non-Labor Income, 200925
Across the nine-county region, 16 percent of people, and 10 percent of families live below the poverty line. The high rate of poverty in the region means that many people will have few resources to deal with potential climate-related impacts, including heat stress, disease, drought impacts on food production, and extreme weather. Governmental and private health care providers and other service providers may encounter rising costs and challenges in meeting the needs of populations below poverty.
Figure 11: Individuals and Families Living Below Poverty, 201026

Detailed Socio-Economic Profiles
These PDF profiles provide an overview of the entire region or a specific county’s economy along with a look at three specific sectors–timber, travel and tourism, and demographics–for each county.
References
- 1. IPCC (Intergovernmental Panel on Climate Change). (2007). Summary for policymakers. In: Climate Change 2007: The Physical Science Basis. Contribution of Working Group I to the Fourth Assessment Report of the Intergovernmental Panel on Climate Change [Solomon, S., D. Qin, M. Manning, Z. Chen, M. Marquis, K.B. Averyt, M. Tignor, and H.L. Miller (eds.)]. Cambridge University Press, Cambridge, UK, and New York. Accessed online at: http://www.ipcc.ch/pdf/assessment-report/ar4/wg1/ar4-wg1-spm.pdf. ↑
- 2. Natural Resource Program Center, National Park Service, U.S. Department of the Interior. (2010). Understanding the Science of Climate Change. Talking Points – Impacts to the Great Lakes. Natural Resource Report NPS/NRPC/NRR – 2010/XXX. Accessed online at: http://www.nps.gov/climatechange/docs/GreatLakesTP.pdf. ↑
- 3. Saunders, S., D. Findlay and T. Easley. (2011). Great Lakes National Parks in Peril: The Threats of Climate Disruption. The Rocky Mountain Climate Organization and National Resources Defense Council. Accessed online at: http://rockymountainclimate.org/images/GreatLakesParksInPeril.pdf. ↑
- 4. National Assessment Synthesis Team (NAST). (2000). Climate change impacts on the United States: the potential consequences of climate variability and change . US Global Change Research Program. Washington, D.C. Accessed online at: http://usgcrp.gov/usgcrp/Library/nationalassessment/overview.htm. ↑
- 5. National Climatic Data Center (NCDC). (2011). National Oceanic and Atmospheric Administration. June – September 2011 Precipitation Map. Accessed online at: http://www.ncdc.noaa.gov/img/climate/research/2011/sep/div-precp-prank-201106-201109.gif. ↑
- 6. McKinney, M. ed. (2004). Outlooks: Readings for Environmental Literacy, 2nd Edition. p. 97. Jones and Bartlett Publishers. ↑
- 7. U.S. Department of Commerce. 2011. Census Bureau, County Business Patterns, Washington, D.C. Figure does not include employment data for government, agriculture, railroads, or the self-employed because these are not reported by County Business Patterns. ↑
- 8. Ibid. ↑
- 9. Ibid. ↑
- 10. Karetnikov, D., M. Ruth, K. Ross, and D. Irani. 2009. Economic Impacts of Climate Change on Michigan. The Center for Integrative Environmental Research, University of Maryland. ↑
- 11. Conservation Biology Center, 2006. Accessed from the Economic Profile System-Human Dimensions Toolkit, Land Use Profile. Headwaters Economics, Bureau of Land Management, U.S. Forest Service. https://headwaterseconomics.org/tools/economic-profile-system/about. The U.S. Census Bureau county boundaries extend over significant portions of Lake Superior, meaning 60% of the regional area is classified as water. We subtracted water from the land area to calculate the percent of land area managed by the Forest Service and the State of Michigan. ↑
- 12. U.S. Department of Labor. 2011. Bureau of Labor Statistics, Quarterly Census of Employment and Wages, Washington, D.C. ↑
- 13. U.S. Department of Commerce. 2011. Bureau of Economic Analysis, Regional Economic Information System, Washington, D.C. Table CA25N ↑
- 14. USDA Forest Service Forest Management. FY 1980 to FY 2011 Cut and Sold Reports. Convertible Products by State, National Forest, and Region. ↑
- 15. U.S. Forest Service Watershed Condition Framework. http://www.fs.fed.us/publications/watershed/. ↑
- 16. Data sources: U.S. Department of Commerce. 2011. Census Bureau, County Business Patterns, Washington, D.C. ↑
- 17. Drs Sarah Nicholls and Dan McCole. Michigan Tourism Year-in-Review and Outlook.http://www.canr.msu.edu/news/michigan_tourism_year_in_review_and_outlook. ↑
- 18. Lorah, P.R. Southwick, et al. 2003. Environmental Protection, Population Change, and Economic Development in the Rural Western United States. Population and Environment 24(3):255-272; McGranahan, D.A. 1999. Natural Amenities Drive Rural Population Change. E.R.S. U.S. Department of Agriculture. Washington, D.C.; More than 100 economists recently urged the President to protect federal lands as an important economic asset. See: https://headwaterseconomics.org/land/reports/economists-president-public-lands. ↑
- 19. U.S. Department of Commerce. 2011. Bureau of Economic Analysis, Regional Economic Information System, Washington, D.C. Table CA05N. ↑
- 20. U.S. Department of Commerce. 2011. Census Bureau, County Business Patterns, Washington, D.C. Data do not include employment data for government, agriculture, railroads, or the self-employed because these are not reported by County Business Patterns. ↑
- 21. Ibid. ↑
- 22. Data sources: U.S. Department of Commerce. 2012. Census Bureau, American Community Survey Office, Washington, D.C.; U.S. Department of Commerce. 2000. Census Bureau, Systems Support Division, Washington, D.C. ↑
- 23. Ibid. ↑
- 24. Cromartie, John and Peter Nelson. 2009. Baby Boom Migration and Its Impact on Rural America. U.S. Department of Agriculture Economic Research Report No. (ERR-79) 36 pp. ↑
- 25. Data Sources: U.S. Department of Commerce. 2011. Bureau of Economic Analysis, Regional Economic Information System, Washington, D.C. Tables CA05N & CA35. ↑
- 26. U.S. Department of Commerce. 2012. Census Bureau, American Community Survey Office, Washington, D.C. Poverty data are calculated by ACS using annual surveys conducted during 2004 to 2010 and are representative of average characteristics during this period. ↑
