- Ninety-nine percent of rural western counties have seen growth in minority populations during the past 35 years.
- In two out of every five rural western counties, population decrease was slowed or reversed because of growth in minority populations.
- Growing minority populations bring economic vitality, social and cultural diversity, and youth into many otherwise shrinking and aging rural communities.
Across the United States—including in the rural West—growth in minority populations is an important driver of demographic change. Starting in 2012, more babies born in the United States have been minorities than non-Hispanic whites. By 2044, the U.S. is expected to be a majority-minority population.
From 1980–2015, 99 percent of counties in the rural West experienced growth in the number of minority residents. Since minority populations tend to be younger than non-Hispanic white populations, increasing minority populations across the rural West are helping to keep school districts open, and jobs and local services from shuttering. As population and jobs increasingly are concentrated in urban places, growth in minority populations is a major force in sustaining and growing the population in many rural counties.
In many ways, the presence of growing minority populations in the rural West is an economic bellwether, demonstrating the presence of employment, educational, and social opportunities. In some places growth in minorities contributes to an overall boom, while in others it helps to sustain a community’s businesses and schools as the broader economy transitions to something new.
Minorities: Hispanics, People of Color, and Foreign-Born Persons
In this study, we examine demographic trends in the rural West among three types of minority populations: Hispanics, people of color, and foreign-born persons. For the purposes of this study, the term “minority” refers to an individual in one or more of these three groups, recognizing that “minority” homogenizes the differences among many ethnic and racial communities. The three minority groups are not mutually exclusive. For example, someone may be Hispanic, black, and originally from Peru. (See details in the Methods and Definitions paper.)
Hispanics represent the fastest-growing demographic in the U.S. in both metro and rural counties, fueled by both natural increase (births) and immigration. Since 1980, 95 percent of rural western counties experienced growth in Hispanic populations.
In 89 percent of rural western counties, people of color have also increased since 1980, but the pace of growth has been slower than Hispanic or foreign-born populations. Rural western counties with the most growth in people of color generally are on and near Indian reservations or faster-growing counties near metropolitan regions.
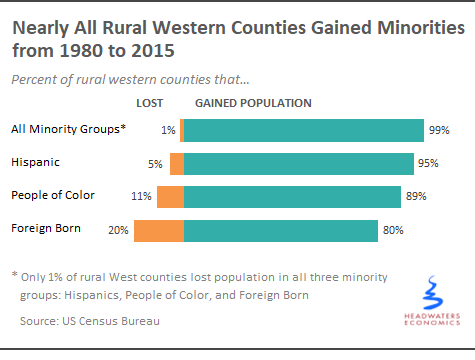
Foreign-born populations also increased across much of the rural West, growing in 80 percent of rural western counties. The “foreign born” category includes anyone not a U.S. citizen at birth: naturalized U.S. citizens, lawful permanent residents, temporary migrants, humanitarian migrants, and unauthorized migrants.
In 2014, unauthorized immigrants comprised approximately 26 percent of the foreign-born population in the U.S. and 25 percent of the foreign-born population in the West. Of these, 85 percent are concentrated in urban counties in California and Arizona.
Minorities in Counties that Gained Versus Lost Overall Population
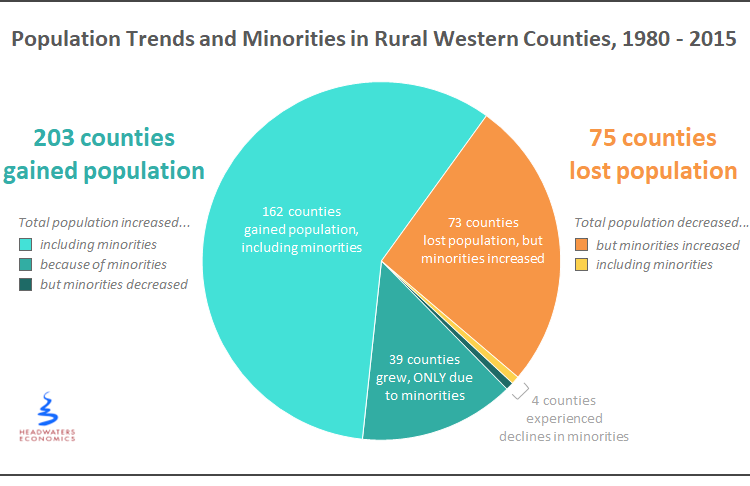
To better understand the implications of changing minority populations, we divided rural western counties into two broad categories: those that gained overall population (203 counties; 73% of rural western counties) and those that lost population (75 counties; 27% of rural western counties) between 1980 and 2015.
The remainder of this report describes the trends in each of these types of communities, the role that minorities play in population changes, and the economic context in which these changes occur.
Minorities in Growing Communities
Three out of every four counties in the rural West grew in population since 1980. Across these 203 growing counties there is tremendous variability in who and what is driving growth:
• In 80 percent, population grew across all groups.
• In 19 percent, all population growth was due to increased minority populations.
• In only two of the 203 growing counties—less than one percent—the number of minorities decreased.
The following sections discuss these three different types of growing counties and the socioeconomic trends behind these patterns.
Growing Across All Groups
More than half of rural western counties saw growth in the number of minority and non-minority residents. In these booming places, minorities played a big part of population and economic growth, but were not the sole drivers.
Table 1 summarizes the growth in total and minority populations in the five counties with the fastest population growth between 1980 and 2015.
| % Change in Total Population 1980-2015 | Total Population 2015 | Change in population 1980-2015: | ||||
|---|---|---|---|---|---|---|
| Total | Hispanic | Non-White | Foreign Born | |||
| Nye County, NV | 371% | 42,625 | 33,577 | 5,537 | 5,477 | 2,708 |
| Eagle County, CO | 295% | 52,576 | 39,256 | 14,918 | 5,307 | 9,447 |
| Lyon County, NV | 280% | 51,657 | 38,063 | 7,411 | 6,520 | 3,021 |
| Summit County, UT | 278% | 38,521 | 28,323 | 4,278 | 1,839 | 3,876 |
| Teton County, ID | 255% | 10,285 | 7,388 | 1,739 | 734 | 1,062 |
In all five of the example counties in Table 1, minorities are now a much larger share of the total population than they were in 1980. In Eagle County, Colorado, for example, the number of Hispanics grew from 849 in 1980 to 15,767 in 2015, a 1,757 percent increase, and Hispanics made up 38 percent of all population growth. Typical of fast-growing places, this county’s non-minority population grew, but its minority populations—particularly Hispanic residents—are growing even faster.
The counties in Table 1 are typical of fast-growing rural communities that experienced dramatic growth in minority populations and exemplify the diverse economic drivers behind rural growth.
Teton County, Idaho and Eagle County, Colorado are close to the resort communities of Jackson Hole and Vail, respectively. They have been relatively affordable places for those employed at the resorts but more recently are developing their own robust economies, particularly around high-wage services.
In Summit County, Utah, home to Park City resort, all minorities are growing, but foreign-born residents have increased faster than other minority groups since 1980—increasing by more than 2,500 percent. Today, foreign-born residents make up nearly 10 percent of the total population. Foreign-born residents may be attracted to jobs in services, and to the amenity lifestyle available in a destination town near Salt Lake City’s major airport and metropolitan center.
Nye and Lyon Counties in Nevada have grown, in part, because of their proximity to larger economic hubs. Nye County is a bedroom community for Las Vegas and its affordability has attracted many retirees. Lyon County, close to Reno and Interstate 80, has benefitted from small-scale manufacturing and, until 2015, was home to one of Amazon’s largest warehouses.
Growth Due Solely to Minorities
Thirty-nine of these 203 growing rural counties—19 percent—grew only because minority populations are growing. Some of these counties have only recently attracted many minorities, while others historically had large Hispanic or Native American populations that continue to grow.
Many of the counties with historically large minority populations are in New Mexico. McKinley County, with its nearby Navajo and Zuni Reservations, grew from 74 percent non-white in 1980 to 83 percent non-white in 2015. Chaves and Luna counties were roughly one-third Hispanic in 1980 and are now more than half Hispanic. These places likely look similar, demographically and economically, to how they looked decades ago.
Some communities, like Adams County, Washington, have historically had relatively modest-sized minority populations that make up a small share of the total population, but have seen substantial growth in recent years. These communities are undergoing significant social and economic changes.
Today, 62 percent of Adams County residents are Hispanic—up from 22 percent in 1980. If not for growth in Hispanic residents since 1980, Adams County would have experienced a population decline of more than 15 percent. Instead, the population grew by 44 percent. Several factors led to this population shift: in-migration of working-age Hispanic residents and their children, out-migration of working-age white residents and their families, and aging and death of the white residents. While the most dramatic change has happened among Hispanic residents, other minority populations also grew in Adams County—the number of people of color grew by 18 percent and the foreign-born population grew by 16 percent.
These demographic shifts have significant economic and social implications. Today more than one-third of small businesses in Othello, Adams County’s largest city, are Hispanic-owned. These businesses include professional services, transportation, retail, and other diverse sectors. After potato-processing facilities, the second-largest employer is the Othello School District, that provides more than 500 jobs. Enrollment in Othello public schools is 88 percent Hispanic.
Growing Despite Losing Minorities
Of the 203 counties gaining population, only two simultaneously lost population across all three minorities: Huerfano County, Colorado and Eureka County, Nevada.
Eureka County, a mining community in central Nevada, historically had a small minority population that has shrunk in recent years, despite growing economic opportunities. Between 1980 and 2015, the number of mining jobs in the county increased 11-fold, from 364 to 3,993. During the same time period, the number of non-white residents decreased from 85 to 70 while total population increased from 1,198 to 1,987. These small changes in minority population do not signal a dramatic exodus, but they do suggest that the mining boom has not attracted new minority residents.
Huerfano County, Colorado—a coal mining community until the 1950s—historically has had a large Hispanic community. After the mine closed, economic opportunities have been limited and the area increasingly has become a retirement destination, with government, health care, and farming as the area’s largest employers. Between 1980 and 2015, the County grew slightly from 6,440 to 6,550 residents but lost 584 Hispanic residents, more than any other county in Colorado. Hispanic residents are now 35 percent of the population, whereas in 1980 they were 44 percent of the population.
This shift is driven largely by young Hispanic residents who grew up in the county, left for education or work opportunities, and did not return. The Hispanic community’s decreasing size as well as its shrinking share of the total population has significant implications for the culture and politics of the community.
Minorities in Communities Losing Population
Seventy-five rural western counties, or just more than one-quarter, experienced net population decrease resulting from the combination of out-migration of young, working-age residents and an aging remaining population with fewer births than deaths.
Among the 75 counties where the overall population decreased, minority populations continued to grow in all but two counties. In other words, growth of minority populations slowed the decline of the rural places that have been struggling the most.
The following sections examine these two types of shrinking counties: those where growth in minorities is slowing overall population decrease, and those that are losing population across all groups. Table 2 summarizes the trends in the five counties that shrank the most relative to their population in 1980.
| % change in total population 1980-2015 | Total population 2015 | Change in population, 1980-2015 | ||||
|---|---|---|---|---|---|---|
| Total | Hispanic | Non-White | Foreign Born | |||
| Harding County, NM | -48% | 565 | -525 | -265 | -26 | -2 |
| Daniels County, MT | -38% | 1,758 | -1,077 | 36 | 3 | -84 |
| Garfield County, MT | -37% | 1,047 | -609 | 6 | 19 | -37 |
| McCone County, MT | -36% | 1,728 | -974 | 25 | 80 | -21 |
| Shoshone County, ID | -35% | 12,571 | -6,655 | 122 | 265 | -211 |
Minorities Slowed Population Decrease
In 73 of the 75 shrinking counties, increased minority population slowed the rate of overall population loss. Many of these shrinking places are historically agricultural economies on the western edge of the Great Plains in Montana, Wyoming, Colorado, and New Mexico (e.g., Daniels, Garfield, and McCone counties in Montana in Table 2). As the large-scale agriculture that has sustained these places becomes increasingly mechanized and efficient, farms employed fewer people.
Thus, young people who were unable to find jobs moved to urban areas for other opportunities. New minority residents may be filling the vacant jobs as young people move away.
Many other shrinking places whose population decrease is being slowed by minority growth are former timber-dependent communities such as Shoshone County, Idaho and Coos County, Oregon. In Shoshone County, total population decreased since 1980, but populations of Hispanics, persons of color, and foreign-born residents all increased substantially in absolute numbers and share of total population.
While jobs in timber-related industries decreased in these communities, jobs in services, government, and the health sector increased as these places with their low cost of living attracted retirees. Minority populations followed these job opportunities.
Losing Population Across All Groups
Only two western counties—San Juan County, Colorado and Harding County, New Mexico—lost population across all groups. These two counties, with populations of 605 and 565, respectively, are among the least populous counties in the U.S. San Juan historically was a mining community and Harding was a ranching community. Both have some tourism today and otherwise struggle to sustain their isolated communities.
Minority Populations Driving County Growth: Implications for the Rural West
The trends in the rural West reflect trends in the country as a whole, but the increasing minority population in the last 35 years is only part of the story of minorities in the West.
A common misperception holds that rural communities mostly consist of non-Hispanic whites descended from European settlers, belying the history of racial and ethnic diversity in the rural West. European settlers displaced American Indian populations across the country, concentrating American Indians on reservations. Many of these reservations continue to grow in some of the most remote areas of the West. Immigrants from Asia were a major force in the development of gold, logging, and railroads across much of the West. Hispanics settled large expanses of the Southwest generations before the U.S. was established. In a rapidly changing West, the impact of this historical diversity often is overlooked.
Today, growing minority populations inject economic vigor, social diversity, and youth into many otherwise stagnant and aging rural communities. These trends will be formative to all dynamics in our communities—from agriculture to civic engagement, economic development to politics, schools to labor force change.
The challenges associated with these changes are not to be dismissed. Many communities are not prepared for an influx of newcomers who may be culturally distinct. Or counties may not be ready to embrace a changing demographic balance. There may be an uneven incorporation of ethnic and racial diversity into politics, economies, and educational systems. As generational divides and political polarization grow across the rural West and the United States, the increasing diversity of our communities will require finding commonalities across race and ethnicity.