For communities to compete in today’s economy, an important first step is to get the economics right. For many rural, western communities this often means understanding the role of the nearby National Forest or other public lands.
Headwaters Economics has created a number of free tools to help local leaders, public land managers, elected officials, business owners, and others improve local community development decisions.
For example, to understand broader trends, we created a series of socioeconomic profiles that examine each of the counties adjacent to National Forests in Region 2 (CO, KS, NE, SD, and WY) showing long-term trends in population, employment, personal income, income earned by industry, wages, age, race and ethnicity, housing affordability, education, and other indicators.
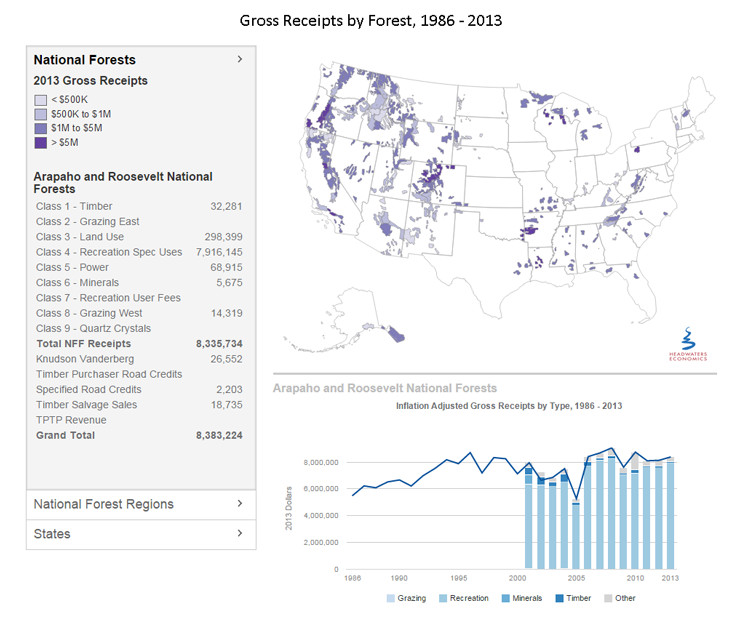
We also produced two interactive maps that help users better understand the commercial activities on National Forests such as income from grazing, recreation, timber harvests, and timber cuts–at a variety of scales.
The first, Gross Receipts from Commercial Activities, allows users to view and download data on gross receipts from all commercial activities at the National Forest, State, and National Forest Region scale for Fiscal Years 1986 to 2013.
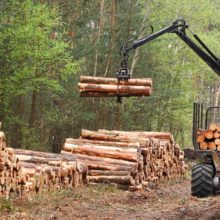
The second, Timber Cut and Sold Reports, allows users to view and download cut and sold data on timber volume, value, and price at the National Forest, State, and National Forest Region scale for Fiscal Years 1980 to 2013.
Both interactive maps are part of our larger work on county payments reform.
In addition to Gross Receipts and the Timber Cut and Sold reports, Headwaters Economics has developed a number of tools to better understand local economies. Each tool uses publicly available, regularly updated statistics from federal data sources such as the Bureau of Economic Analysis and Bureau of the Census, U.S. Department of Commerce; Bureau of Labor Statistics, and U.S. Department of Labor.
- Socioeconomic Profiles: the Economic Profile System is a free, easy-to-use software that provides detailed reports at the community, county, or state level.
- West-Wide Economic Atlas: Interactive map to quickly explore socioeconomic and land use trends in the West at the county or state level.
- Non-Labor Income: Representing 60 percent of net personal income growth in the last decade, non-labor income makes up 41 percent of total personal income in the West.
Region 2 Socioeconomic Profiles
Explore trends in the counties around each Region 2 National Forest using the two reports below. The first, Measures, shows long-term trends in population, employment, personal income, income earned by industry, unemployment, wages, and other factors.
The second, Demographics, describes the study area in terms of population, age, race and ethnicity, poverty, income distribution, housing affordability, and education.