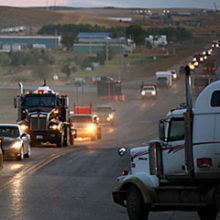
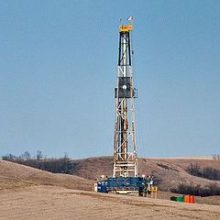
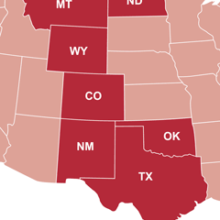
Activity Continues to Reflect Colorado’s Overall Share of Nation’s Fossil Fuel Reserves
Oil and natural gas extraction in Colorado is performing in line with regional and national trends, but the industry faces steep competitive challenges in today’s energy markets. The strength of crude oil prices relative to natural gas prices has driven a dramatic shift in drilling activity from natural gas to oil across the region and within Colorado. This context makes the recovery of a significant share of Colorado’s pre‐recession natural gas development activity somewhat remarkable.
This report uses graphical analysis to offer a snapshot of Colorado’s oil and natural gas industry, its direction, and implications for Colorado’s economy. The purpose of this report is to educate decision makers and the public about the current health of Colorado’s oil and gas industry, what factors are affecting the energy sector, and how the state can better benefit from its fossil fuel industry.
Gas & Oil Prices | Drilling Activity | Regional Trends | Energy Industry | Renewable Energy | Tax Revenue | Conclusions
Summary Findings
- The strength of crude oil prices relative to natural gas prices has driven a dramatic shift in drilling activity from natural gas to oil across the region and within Colorado.
- Colorado’s relative advantage in dry natural gas is a disadvantage in today’s energy markets that favors states with proven unconventional oil fields, including North Dakota. Despite the challenges Colorado’s energy industry faces, it has recovered a significant share of pre‐recession drilling activity.
- Recent volatility in the oil and natural gas industry’s employment, personal income, and share of the state’s gross domestic product have mirrored regional volatility in drilling activity and commodity prices.
- During the most recent recession, the oil and natural gas industry lost jobs at a faster rate than all industries except construction in Colorado, and today make up less than one percent of total employment statewide.
- Colorado’s economy has strong advantages in the renewable energy sector. Diversifying the energy economy should be an important part the state’s long‐term energy policy.
- A more effective energy tax policy could help Colorado realize the full economic benefits of energy development and mitigate its impacts. Compared to Wyoming, Colorado will collect $700,000 less tax revenue on each new well drilled. Tax incentives expose the state to revenue volatility and undermine efforts to address impacts in local areas.
- Rig counts in Colorado in June, 2012 are back to levels experienced during the natural gas run up in 2005 and 2006.
Price Gap Widens Between Natural Gas and Oil
High commodity prices for oil and natural gas combined with new horizontal drilling and hydraulic fracturing technology unlocked a boom in natural gas drilling activity and production in Colorado and across the country during the first seven years of the 2000s. The national recession ended the boom with prices for both commodities crashing as demand fell and natural gas in particular was over supplied. As the U.S. slowly emerges from the recession, oil prices have recovered strongly responding to global demand and geopolitics, but natural gas prices have continued to decline.
Figure 1: Energy Equivalent U.S. Price of Crude Oil and Natural Gas*, January 2000 to March 20121
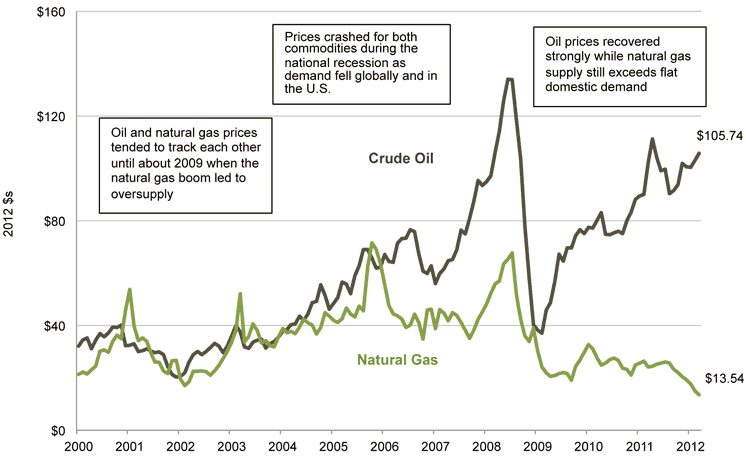
* The U.S. Geological Survey estimates that one barrel of oil is equivalent to six thousand cubic feet of gas.2 The figure compares the price of domestic crude oil to the oil equivalent price of natural gas by multiplying the wellhead price of domestic natural gas (dollars per mcf) by six.
Widening Price Gap Shifts Drilling Activity from Natural Gas to Oil
Trends in drilling activity are important both as indicators of industry preferences for regions and resources, and because they serve as a good proxy for employment trends. Nationally, more than three-quarters of oil and gas employment, on average, is associated with drilling and exploration.3
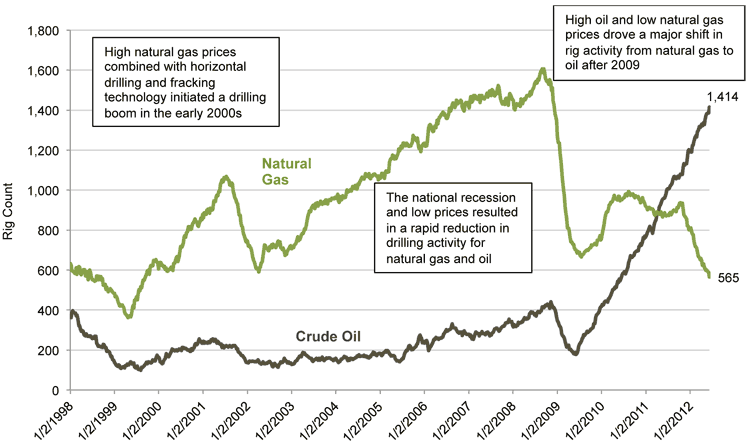
Price is the most important driver of industry investment decisions. Price volatility over the last decade led to booms and busts in drilling activity in oil and natural gas. More recently, the strength of crude oil prices relative to natural gas prices has driven a dramatic shift in drilling activity from natural gas to oil across the region and within Colorado. At the peak of the natural gas boom, about 2,000 drilling rigs were active in the U.S., four fifths of them drilling for natural gas. As of June 8, 2012, the ratio has nearly reversed with only 565 rigs drilling for natural gas, and 1,414 drilling for oil.
Figure 2: Rigs Drilling for Oil and Natural Gas in the U.S., January 1998 to June 2012
Colorado Industry Activity on Par with Regional Trends and Proven Reserves
Drilling activity across six Western states have followed the same trends: the total rig count peaked at 426 in August, 2008, plummeted to 158 by June of 2009, and has subsequently recovered to 465 by June 2012.
Figure 3: Rig Counts in Rocky Mountain States and North Dakota, Weekly, 1/3/1997 through 6/8/2012
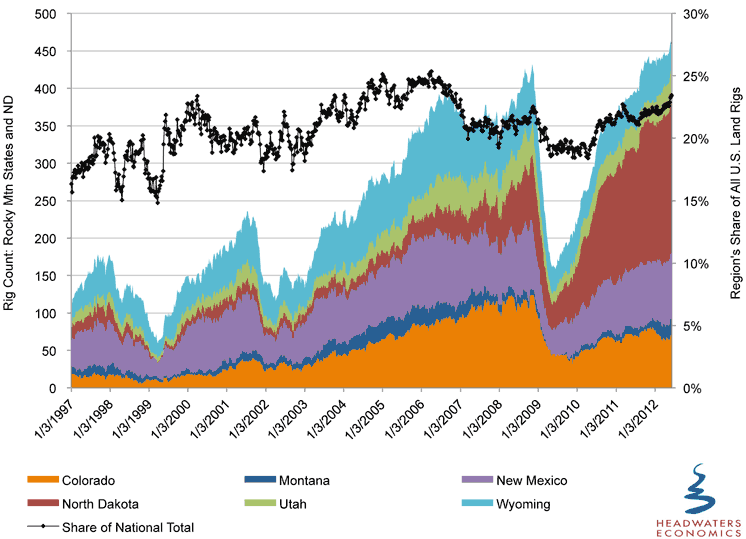
Total rigs in the region are higher than before the recession, reflecting the oil boom in North Dakota. In the five Rocky Mountain states, rig counts peaked at 352 in August, 2008 and have recovered to 262 in June, 2012–at 74 percent of the pre‐recession total.4 Colorado is down from the peak, but the industry has recovered from recession‐lows. Rig counts in Colorado in June, 2012 are back to levels experienced during the run up in 2005 and 2006.
Across a six‐state region, North Dakota captured 44 percent of rig activity in June, 2012, up from only 11 percent of rig activity across the region before the national recession. The Bakken formation’s unconventional oil is the main target for all the drilling rigs moving into the state. Rigs can move seamlessly between unconventional oil and natural gas resources where the same horizontal drilling and hydraulic fracturing technology is applied to extraction
Figure 4: State Share of Six‐State Weekly Rig Activity Before and After the National Recession
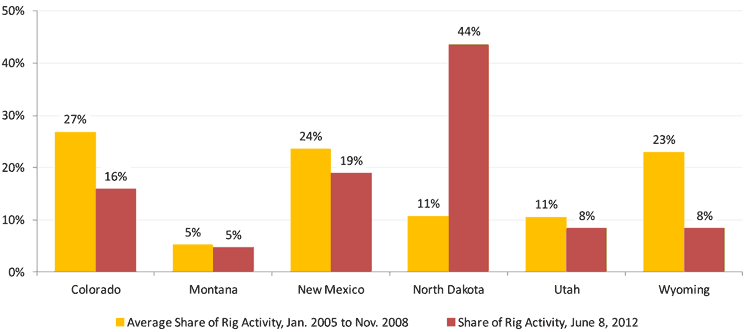
Colorado and Wyoming saw the largest declines in drilling rig activity based on the two state’s relative strength in natural gas before the recession. Colorado fell from 27 percent of total rig activity in the region to 16 percent, while Wyoming fell more steeply from 23 percent of total rig activity in the region to eight percent.
The pattern of rig distribution across the states reflects the relative strength of each in oil vs. natural gas resources. Colorado’s energy industry has experienced volatility and drilling activity is down over the last four years. These trends are consistent with national and regional trends in price, and the state’s relative advantage in proved reserves of natural gas relative to oil.
Market forces have also directed natural gas production to wet gas plays rather than the dry gas plays that were the focus of development during the pre‐recession boom in Colorado and Wyoming. Wet gas plays feature associated natural gas liquids, the value of which has been boosted by high crude oil prices. While areas of the Rockies such as the Denver‐Julesberg Basin have high NGL potential, production to date has favored areas with ready access to NGL processing capacity (roughly 70 percent of NGL processing capacity is in Louisiana).
Ultimately, declines in natural gas drilling activity led to production declines. Colorado’s natural gas production has fallen from a peak of 145,422 mcf in October 2010 to 107,870 mcf in March 2012 while also showing significant volatility.5 Over the same period, oil production is up significantly from 2.6 to< 3.6 million barrels per month.6
Figure 5: Natural Gas and Crude Oil Production Trends in Colorado, January 2000 to March 2012
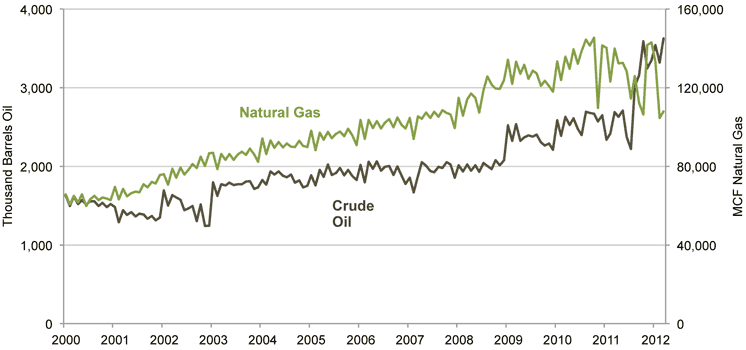
The combination of declining production and low natural gas prices have driven down the production value of natural gas extraction in Colorado to the point that the production value of oil, rising with increased production and relatively strong prices, was greater in March, 2012.
Figure 6: Monthly Production Value of Oil and Natural Gas in Colorado, January 2000 to March 20127
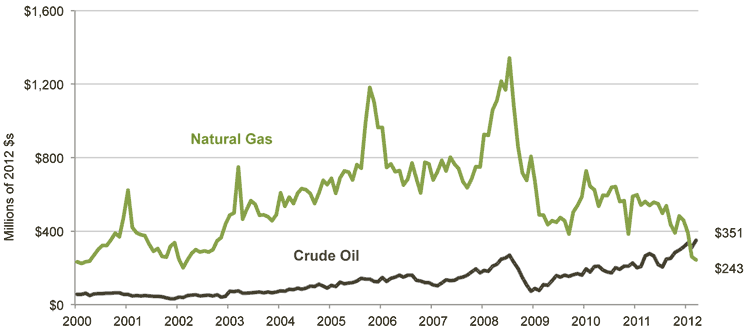
The production value of natural gas rose significantly from 2000 to 2009, and showed significant volatility driven by large swings in the price of natural gas. The national recession ushered in drastically lower prices for natural gas and caused production value to plummet by nearly $1 billion from July, 2008 to September, 2009. The production value for natural gas reached a low not seen since 2002 in Colorado. At the same time, the production value of oil reached at least a 30 year high surpassing natural gas production value for the first time in decades.
Role of the Energy Industry in Colorado’s Overall Economy
The mining sector (including oil and natural gas) had a relatively small share of overall employment in Colorado in 2010–roughly one and a half percent.8 That year, the oil and gas sector was 0.8 percent of jobs in the state, employing 26,167 Coloradans.9 By comparison, health care services are roughly nine percent of employment; professional, scientific, and technical services are also nine percent; and finance and insurance represents six percent of employment.10 Combined, these three sectors employed 760,139 Coloradans.
Figure 7: Employment by Industry, Percent of Total, Colorado 2010
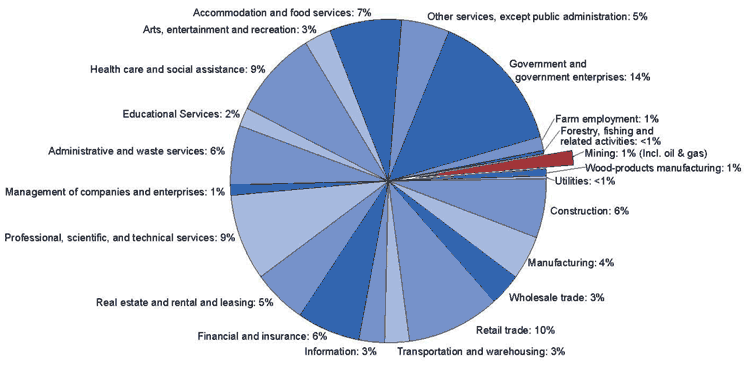
Looking at changes in employment by industry in Colorado from 2001‐2010, government saw the largest increase with 63,454 net new jobs; health care added 61,223; finance and insurance added 50,970; professional, scientific, and technical services 41,969; real estate 37,091; and mining 22,607.11
In 2010, the oil and natural gas sector contributed to one percent of total state personal income12 and 2.3 percent of total state gross domestic product (State GDP), the latest year for which data are available.13 The relatively larger share of personal income and State GDP as compared to employment reflects higher average wages in the energy industry.
Figure 8: Employment, Personal Income, and Gross Domestic Product Percent of State Total for the Oil and Natural Gas Industry in Colorado, 1990‐2010
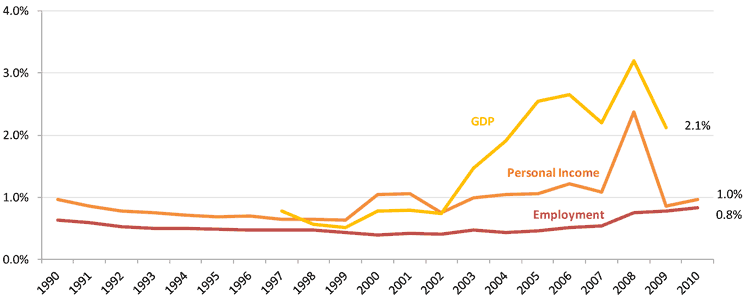
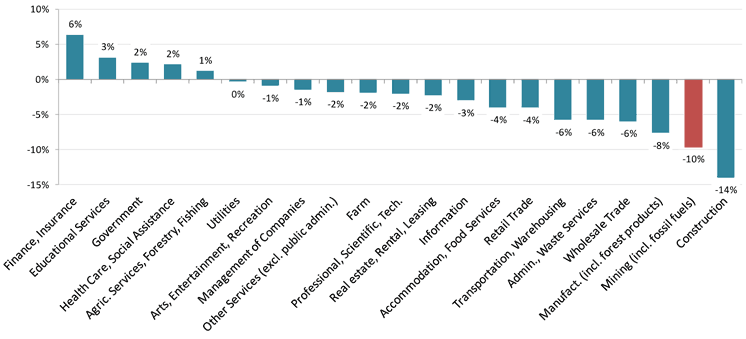
Trends in employment, personal income, and State GDP show continued volatility in the industry. The mining sector lost jobs in absolute terms at the fastest rate of any industry except construction from 2008 to 2009. With natural gas prices continuing to fall and drilling activity still on the decline, it is unlikely that oil and natural gas extraction can lead Colorado’s economic recovery.
Figure 9: Percent Change in Employment by Industry, Colorado 2008‐200914
Renewable Energy
While Colorado’s fossil fuel energy production has rebounded somewhat since the recession, a number of studies have found that the state’s renewable energy economy represents a bright spot of economic opportunity, and the growth of Colorado’s renewable energy sector has outpaced that of all other Rocky Mountain States.15 Overall, “green jobs,” of which renewable energy is an important part, accounted for 2.2 percent of all employment according to the Brookings Institute (about 51,000 jobs), meaning this sector is also relatively small, but complements the state’s energy portfolio.16
The state’s leading position in renewable energy did not happen by accident. Colorado’s research and development expertise and its strategy of targeted public policy and strong support for business has made it a competitive center of clean tech innovation that leads the region in almost every indicator, including capturing the most clean energy‐related jobs, venture capital, and public funding.
The Headwaters Economics report from 2010, “Clean Energy Leadership in the Rockies: Competitive Positioning in the Emerging Green Economy,” compares Colorado, Montana, New Mexico, Utah, and Wyoming. That report showed that fifty percent of the green enterprises in the five state region are based in Colorado, followed by Utah and New Mexico (16%), Montana (11%), and Wyoming (6%).
Colorado also dominated in attracting investment. The state won 75 percent of the total $800 million of clean tech venture capital invested in the region between 1999 and 2008 and ranked fifth among all U.S. states from 2006 to 2008. Colorado also claimed 69 percent–$296 million–of the competitive funding for clean technology directed to the five states in the 2009 federal stimulus bill.
More recently, in late May the 2012 State Clean Energy Index ranked Colorado fifth nationally. The rating system (which also ranked Colorado fifth of all states in 2011), was produced by Clean Edge, a clean‐tech analysis firm.17 Colorado’s ranking was based on its leadership in all three of the major categories: installed technology (clean electricity, clean transportation, energy intelligence & green building); policy outlook (regulations & mandates, incentives); and invested capital (financial, human & intellectual). There are several reasons for Colorado’s leadership role.
Strategic Pairing of Incentives with Clear Policy Goals: Colorado, with its commitment to a 30 percent Renewable Portfolio Standard (RPS) and to achieving an 11.5 percent decrease in energy consumption by investor‐owned utilities by 2020, leads the region and the nation in clean energy and efficiency mandates. By comparison, Utah has an RPS goal with no enforcement and Wyoming has neither.
Encourage and Capture Large‐Scale Investment: Colorado, already a leader in attracting private and public investment, should further take advantage of its complete package of serious policies, incentives, and proven record in developing technological expertise and a skilled workforce.
Well‐Resourced Business Environment: Colorado’s research and high tech manufacturing industries make it a regional leader attractive to a variety of green economy businesses that require skilled workers and access to world class facilities.
Colorado, while a renewable energy leader, should not take its position for granted. As the clean energy and energy efficiency sectors grow in the coming years, more and more states will join Colorado in competing to attract the associated jobs, revenues, and investments.
Colorado Tax Revenue and Fiscal Policy
How states tax and distribute revenue has a huge influence on a community’s ability to mitigate production impacts and benefit from fossil fuel extraction.18 Colorado collected half a billion dollars or more each year in oil and natural gas revenue since 2005, peaking at more than $1 billion in 2009.19
Figure 10: Colorado Oil and Natural Gas Tax and Royalty Revenue, FY 2001 — FY 2011
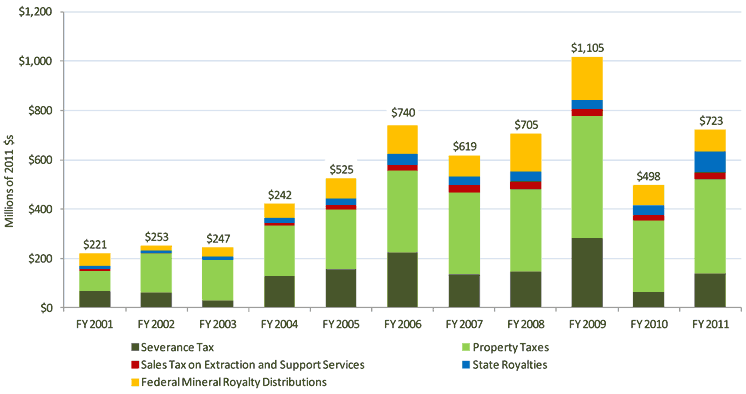
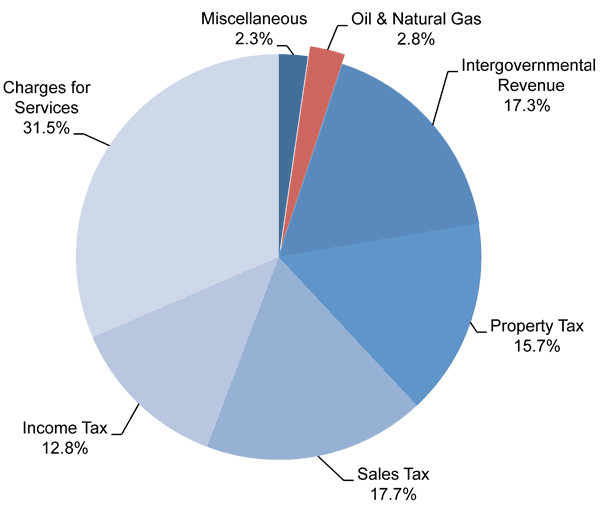
The combined total of severance, property, and sales taxes, and federal and state royalties made up 2.8 percent of total state and local government tax revenue in FY 2009.20
Figure 11: Percent of Total Revenue, Colorado, FY 2009
Colorado’s effective tax rate is low compared to most other energy‐producing states in the West, meaning Colorado collects less tax revenue that its peers. In fiscal year 2010, the state’s effective tax rate on oil and natural gas of 4.4 percent ranked behind Wyoming (11.4%) and Montana (10.5%), and ahead of Utah (3.3%).
Figure 12: Effective Tax Rate by State, FY 201121

Colorado’s unique fiscal policy and tax incentives exacerbate revenue volatility for state and local governments. The recent recession and dramatic changes in energy prices caused Colorado’s effective tax rate to swing from a high of 8.5 percent in FY 2009 to a low of 4.4 percent in FY 2010. By comparison, Wyoming’s effective tax rate is most stable over time, varying from a low of 10 percent in FY 2008 to a high of 12.1 percent in FY 2006.
In addition, Colorado’s tax structure extends the lag inherent to oil and natural gas revenue between when drilling impacts occur and when property taxes are ultimately collected one to two years later. As a result, Colorado communities will not see significant revenue from drilling for one to two years after impacts occur.
Figure 13: Cumulative Tax Revenue Based on Three Year’s Production from an Average Unconventional Oil Well22
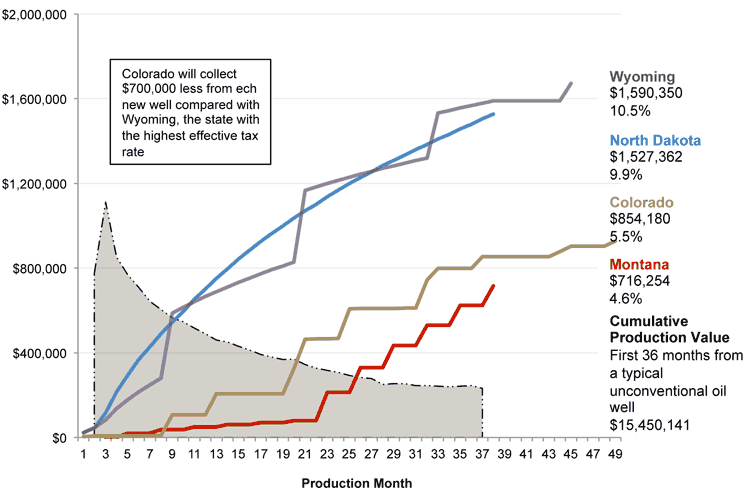
The black dashed curve in Figure 13 shows the production curve, or type curve, for an average horizontal unconventional oil well based on a sample of 1,165 wells drilled since 2008 in the Bakken formation in North Dakota. The average well produced 157,222 barrels of oil over the first 36 months of production, peaking at an average rate of 372 barrels per day in the second month and declining to a low of 78 barrels per day in the 36th month.
Each state line (Figure 13) is a representation of that state’s tax policy applied to the average well. The state lines show the cumulative revenue that each state will collect based on 36 months of production; illustrating when tax revenue is collected and the effective overall tax rate over the first three years of production.
Colorado will collect $700,000 less from each unconventional oil well drilled in the state compared to Wyoming. The state also takes the longest time to collect revenue, with the last revenue coming 13 months after the end of the three year production period. By comparison, North Dakota and Montana collect revenue within one to four months after the production period ends.
Some argue that Colorado’s low tax rate and incentives must be retained, or drilling activity will move to neighboring states.23 Despite these warnings, the academic literature shows that taxes are largely irrelevant to total oil production.24 Chiefly, the oil industry is resource dependent, and cannot move the location of production, like a textile mill or auto manufacturer, to seek out lower labor costs or to win greater tax concessions. According to the American Petroleum Institute, “U.S. based oil and gas companies must structure their operations and invest substantial capital where the resource is found rather than where the best tax regime is located.”25
The main outcome of drilling and production tax deductions and incentives is to reduce and delay tax revenue collections, which may present problems for communities struggling to keep pace with impacts on infrastructure and growing demands for community services.
Conclusions and Recommendations
Oil and natural gas extraction in Colorado is performing in line with regional and national trends. The main driver of industry activity is price. Relatively high oil prices compared to natural gas prices are driving a major shift in drilling activity from natural gas to oil in the state and across the region.
Colorado’s natural gas industry has declined from the pre‐recession boom, but has recovered a significant share of activity. The industry will face continued challenges, however, as natural gas prices remain low and drilling rigs are moving to North Dakota and Texas where significant oil plays have reversed a decades‐long decline in domestic oil production.
The result of the widening gap between oil and natural gas prices, and continued volatility over the last decade, is wide swings in the production value of oil and natural gas in Colorado. The economic role of the oil and natural gas industries have followed the typical boom and bust cycle with employment and personal income rising during the boom from 2005 to 2008 and then falling more rapidly than any other economic sector but construction during the most recent recession.
Overall, the fossil fuel industry makes up only a small portion of total state jobs and personal income, and remains volatile. Green jobs are also a relatively small share of the overall economy, but the state maintains competitive advantages and continued investments and commitments to renewable energy and other green economy sectors will diversify and stabilize the state’s energy industry.
A more effective energy tax policy could help Colorado realize more benefits from energy development and help mitigate its impacts. Compared to Wyoming, Colorado will collect $700,000 less tax revenue on each new well drilled. Tax incentives expose the state to revenue volatility and undermine efforts to address impacts in local areas.
Endnotes
- 1. Energy Information Administration, Monthly U.S. Crude Oil First Purchase Price by Area, Dollars per Barrel. 2011 http://www.eia.gov/totalenergy/data/annual/showtext.cfm?t=ptb0518; Monthly Natural Gas Wellhead Prices by Area (Dollars per Thousand Cubic Feet). 2011. http://www.eia.gov/dnav/ng/ng_pri_sum_dcu_nus_a.htm. ↑
- 2. U.S. Geological Survey World Petroleum Assessment 2000–Description and Results by USGS World Energy Assessment Team. Washington, D.C. Table AR‐1. World level summary of petroleum estimates for undiscovered conventional petroleum and reserve growth for oil, gas, and natural gas liquids (NGL). http://energy.cr.usgs.gov/WEcont/world/woutsum.pdf. ↑
- 3. Reporting U.S. data for 2008. U.S. Department of Commerce. 2010. Census Bureau, County Business Patterns. ↑
- 4. Rig count information from Baker Hughes, http://investor.shareholder.com/bhi/rig_counts/rc_index.cfm. ↑
- 5. Colorado Oil and Gas Conservation Commission, Reports Portal, Monthly Coalbed and Natural Gas Produced by County. http://cogcc.state.co.us/. ↑
- 6. Energy Information Administration. Crude Oil Production, Monthly‐Thousand Barrels by Area. http://www.eia.gov/totalenergy/data/annual/showtext.cfm?t=ptb0518. ↑
- 7. EIA, Monthly U.S. Crude Oil First Purchase Price by Area; EIA, Monthly Natural Gas Wellhead Prices by Area; EIA, Crude Oil Production, Monthly‐Thousand Barrels by Area; Colorado Oil and Gas Conservation Commission, Monthly Coalbed and Natural Gas Produced by County; U.S. Department of Labor, Bureau of Labor Statistics, Washington, D.C. Consumer Price Index All Urban Consumers (CPI‐U) U.S. City Average, All Items 1982=100. ftp://ftp.bls.gov/pub/special.requests/cpi/cpiai.txt. ↑
- 8. U.S. Department of Commerce. 2012. Bureau of Economic Analysis, Regional Economic Information System, Washington, D.C. Table SA25N. ↑
- 9. Ibid. ↑
- 10. Ibid. ↑
- 11. U.S. Department of Commerce. 2012. Bureau of Economic Analysis, Regional Economic Information System, Washington, D.C. Table CA25N. ↑
- 12. U.S. Department of Commerce. 2011. Bureau of Economic Analysis, Regional Economic Information System, Washington, D.C. Tables SA05N. ↑
- 13. U.S. Department of Commerce. 2011. Bureau of Economic Analysis. Gross Domestic Product by State. ↑
- 14. U.S. Department of Commerce. 2011. Bureau of Economic Analysis, Regional Economic Information System, Washington, D.C. Table CA05N.
- 15. Headwaters Economics. 2010. Clean Energy Leadership in the Rockies: Competitive Positioning in the Emerging Green Economy, Bozeman, MT. This report compares how Colorado, Montana, New Mexico, Utah, and Wyoming are taking advantage of clean energy opportunities and five keys for future growth. ↑
- 16. Muro, M., et. al. (2011). Sizing The Clean Economy: A National And Regional Green Jobs Assessment. Brookings Institute. http://www.brookings.edu/research/reports/2011/07/13‐clean‐economy ↑
- 17. News Release “California, Oregon, Massachusetts, Washington, and Colorado Lead the Nation in Clean‐Energy Leadership.” May 30, 2012. http://www.cleanedge.com/sites/default/files/pr/StateIndex2012v.5.30.12.Final.pdf. ↑
- 18. Headwaters Economics. 2012. Benefiting from Unconventional Oil: State Fiscal Policy is Unprepared for the Heightened Community Impacts of Unconventional Oil Plays, Bozeman, MT. ↑
- 19. Colorado Department of Revenue, Annual Reports, FY 2001‐2011; Colorado Department of Local Affairs, Division of Property Taxation, Annual Reports FY 2001‐2011; Colorado State Land Board, Annual Reports, FY 2001‐2011. Office of Natural Resources Revenue, Statistics, Federal Mineral Royalty Disbursements to States. FY 2001‐2011. ↑
- 20. U.S. Census of Governments, State and Local Finances. State and Local Government Revenue, FY 2009. ↑
- 21. The effective tax rate measures actual taxes paid based on gross production value, taking into account different tax structures, tax rates, deductions, and incentives. Headwaters Economics and Bill Lane Center for the American West. 2012. Benefiting from Unconventional Oil. Bozeman, MT. https://headwaterseconomics.org/energy/oil-gas/unconventional-oil-and-north-dakota-communities/ ↑
- 22. Headwaters Economics and Bill Lane Center for the American West. 2012. Benefiting from Unconventional Oil. Bozeman, MT. https://headwaterseconomics.org/energy/oil-gas/unconventional-oil-and-north-dakota-communities/ ↑
- 23. See for example comments from industry leaders in: Nick Snow, Feb. 14, 2011,
Obama keeps pledge to end oil tax incentives in 2012 budget request. Oil and Gas Journal online. Accessed on 2‐14‐2011. Responding to a bill introduced into Montana’s legislature to remove a production tax incentive, the Montana Petroleum Institute warned that companies would quickly look elsewhere to drill new wells, resulting in job losses and higher property taxes for those left behind.23 The same warning is levied in North Dakota where the main message of the “FixTheTax” campaign was one of competitiveness with neighboring states, offering first‐hand accounts of industry fleeing the state to avoid high taxes.23 Jack N. Gerard, president of the American Petroleum Institute, warns that any cut in subsidies will cost jobs due to the same tax competition between nations for production. “These companies evaluate costs, risks and opportunities across the globe,” he said. “So if the U.S. makes changes in the tax code that discourage drilling in gulf waters, they will go elsewhere and take their jobs with them.” NY Times http://www.nytimes.com/2010/07/04/business/04bptax.html?_r=2. - 24. Ujjayant Chakravorty, University of Alberta, Shelby Gerking, University of Central Florida, and Andrew Leach, University of Alberta: State Tax Policy and Oil Production: The Role of the Severance Tax and Credits for Drilling Expenses. Paper presented at the American Tax Policy Institute Energy Taxes Conference organized by Gilbert E. Metcalf, Tufts University. Held October 2009. Papers to be published by Cambridge University Press. http://www.americantaxpolicyinstitute.org/research.html; S. Gerking, W. Morgan, M. Kunce, and J. Kerkvliet, Mineral Tax Incentives, Mineral Production and the Wyoming Economy, report prepared for the Mineral Tax Incentives Subcommittee, Wyoming State Legislature, 2000, http://eadiv.state.wy.us/mtim/StateReport.pdf and, M. Kunce, S. Gerking, W. Morgan, and R. Maddux, State Taxation, Exploration, and Production in the U.S. Oil Industry, report prepared for the Wyoming State Legislature, 2001, http://legisweb.state.wy.us/2001/interim/app/reports/oiltaxpaper%2011‐26‐01.pdf; Allaire, J and S. Brown. 2009. Eliminating Subsidies for Fossil Fuel Production: Implications for U.S. Oil and Natural Gas Markets, Resources for the Future Issue Brief 09‐10; Metcalf, G.E. 2007. “FederalTax Policy Toward Energy. Tax Policy and the Economy,” Vol. 21, pp. 145‐184.; Headwaters Economics. 2008. Energy Revenue in the Intermountain West: State and Local Government Taxes and Royalties from Oil, Natural Gas, and Coal. Bozeman, MT. ↑
- 25. American Petroleum Industry. 2012. Putting Earnings into Perspective: Facts for Addressing Energy Policy. http://www.api.org/(accessed 5/15/2012). ↑
