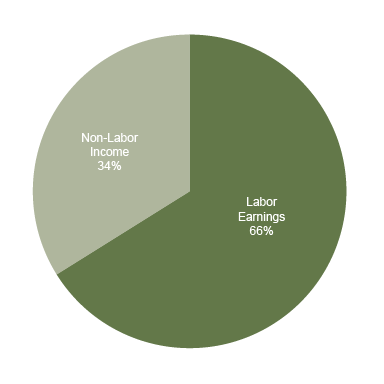
Non-labor income (NLI) is one of the largest and fastest growing sources of income in the West, constituting 34 percent of total personal income in 2011; and 60 percent of net growth in real personal income during the last decade. In many counties non-labor income is the single largest contributor to income, particularly in rural areas.
Comprised of three main types—investments, age related payments, and hardship payments—non-labor income is affected by the stock market, retiring Baby Boomers, and changes to Medicare, Medicaid, and Social Security.
Non-labor income is important for all western counties. To understand how NLI can affect local economies, it is important to understand both the makeup of non-labor income and how it is distributed. This post includes a manuscript (PDF) and white paper (PDF) that describe our non-labor income research, a county level sortable data table, and an interactive showing individual counties.
Summary Findings
- Rural counties generally have higher shares of non-labor income.
- The amount and type of non-labor income varies greatly by county across the West.
- Non-labor income payments associated with investment income are related to higher educational attainment, an older population, and larger construction, health care, and real estate sectors.
- Payments associated with aging are related to lower household income and educational attainment, higher poverty and unemployment rates, and a larger health care sector.
- Payments associated with economic hardship are associated with lower household income and educational attainment, higher poverty and unemployment, and a shrinking population. The health care sector is relatively large in communities with a high proportion of hardship payments.
- Future non-labor income levels will depend on investment performance, demographic trends, and polices that will have widespread effects, particularly in the rural West.
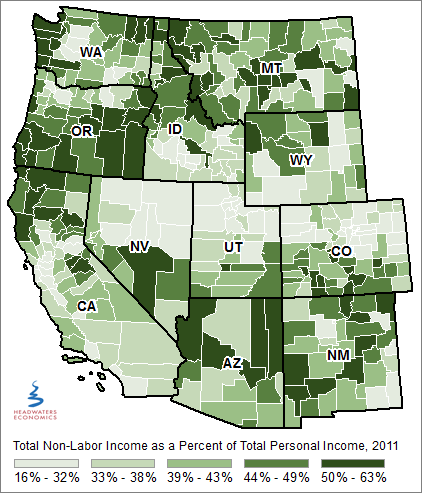
County Level Non-Labor Income as Percent of Total Personal Income, 2011
Background
Non-labor income, also known as non-earnings income, is one of the largest and fastest growing sources of personal income in the U.S. economy, particularly in the West.
Across the nation, non-labor income constituted 54 percent of net new real personal income in the last decade, while in the West during that time NLI constituted 60 percent of net new personal income growth. In both the U.S and the West, NLI made up 34 percent of total personal income in 2011.
Measured as a share of each county’s total personal income, on average non-labor comprised 39 percent of U.S. counties’ personal income and 41 percent of Western counties’ personal income. By 2011, NLI exceeded labor earnings in 16 percent of western counties (as opposed to nine percent in non-western counties).
We show data for 2011 since it is the most current year for which detailed, county-level non-labor income data are available.
The importance of separately evaluating the sources of non-labor income is illustrated by looking at the differences between two counties that have more than half of total personal income from NLI: Lincoln County, Montana and Teton County, Wyoming.
For Lincoln County, non-labor income is driven by an aging population and higher levels of economic hardship, likely related to the loss of mining and timber jobs and the out-migration of the younger, working population. In Teton County, high non-labor is an indication of economic growth that is led by investments, likely driven by the stock market and the in-migration of wealthy people.
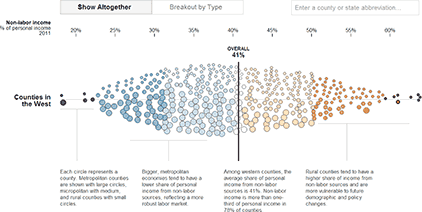
Interactive Tool: County Level Analysis
Headwaters Economics has created an interactive showing the performance of individual counties; comparing non-labor income totals and also breakdowns of investment-, age-, and hardship-related payments. We also created a sortable data table for users to rank counties and provide context.
Size and Growth
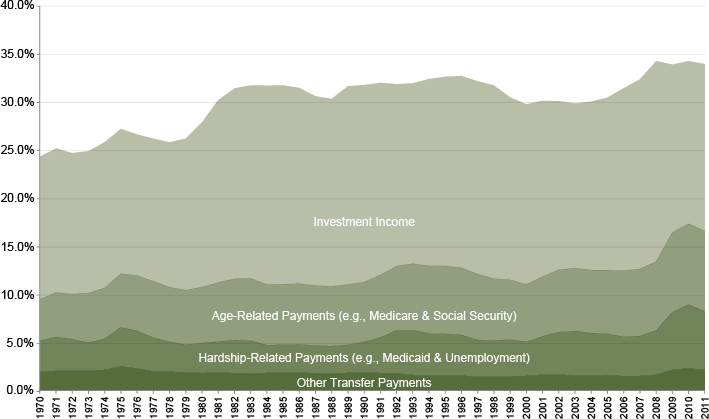
Non-labor income in 2011 represented 34 percent of the West’s total personal income. There are three categories:
- Investment-related income represents just more than 17 percent, or $520 billion of total personal income.
- Age-related income is slightly more than eight percent, or $250 billion of total personal income.
- Hardship-related payments are just above six percent, or $180 billion of total personal income.
- All other payments combined are just more than two percent, or $70 billion of total personal income.
Non-Labor Income Types: Percent of Total Personal Income in the West
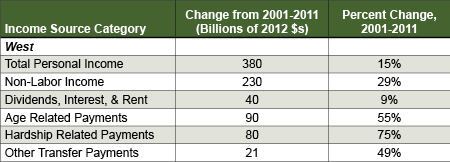
Change in Total Personal Income and Non-Labor Income in the West, 2001-2011
Not only is non-labor income already a large source of income, it is growing quickly, twice as fast as total personal income. The nearby table reviews the growth rate of the last ten years available (2001-2011).
Impact
Our manuscript(PDF) and white paper (PDF) look at the relationships between the three types of non-labor income (Investment, Age, and Hardship) and socioeconomic performance at the county level and the interaction with three economic sectors: construction, health care, and real estate. The maps and bullet points below summarize this larger research.
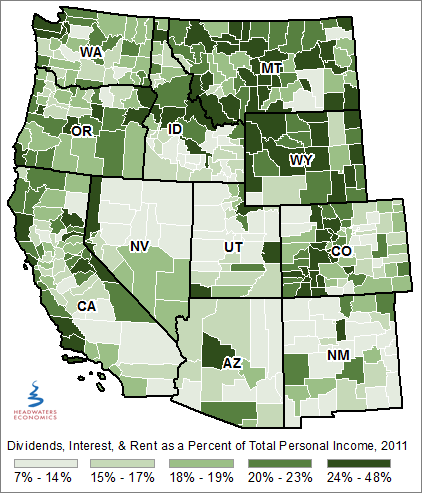
Investment-Related Non-Labor Income as Share of Total Personal Income, 2011
Relationships in Counties with Higher Investment-Related Income
- Investment-related non-labor income comprised 17% of total personal income in the West.
- Of these counties, 143 or 35% had at least 20% of total income from investment-related income in 2011.
- For the 143 counties, 117 or 82% were non-metro.
- The counties are associated with higher educational attainment, an older population, and larger construction, health care, and real estate sectors.
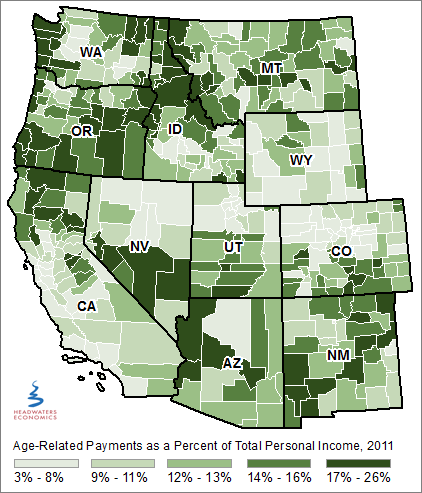
Age-Related Non-Labor Income as Share of Total Personal Income, 2011
Relationships in Counties with Higher Age-Related Income
- Age-related payments comprised 8% of total personal income in the West.
- Of the counties, 19 or 5% in the West had at least 20% of personal income from age-related sources in 2011.
- Of these 19 counties, 17 0r 90% were non-metro.
- Payments associated with aging are related to lower household income and educational attainment, higher poverty and unemployment rates, and a larger health care sector.
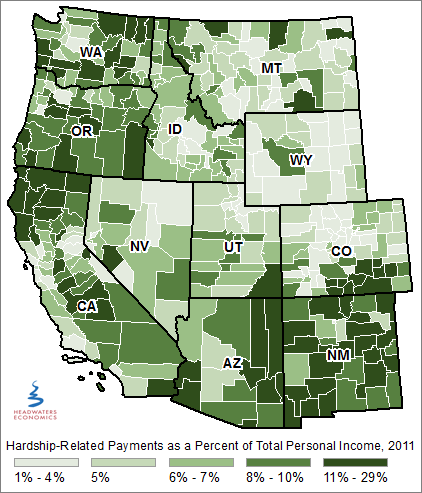
Hardship-Related Non-Labor Income as Share of Total Personal Income, 2011
Relationships in Counties with Higher Hardship-Related Income
- Hardship-related payments comprised 6% of total personal income in the West.
- Of the counties, five or 1% had at least 20% of total personal income from hardship-related payments in 2011.
- Of these five counties, all were non-metro.
- Payments associated with economic hardship are related to lower household income and educational attainment, higher poverty and unemployment, and a shrinking population. The health care sector is relatively large in communities with a high proportion of hardship payments.
Conclusions
Non-labor income is large and growing in almost every part of the West. To understand how non-labor income can affect local economies, it is important to understand both the makeup of NLI and how it is distributed.
Investment performance, government policies, and demographic trends all will affect the future level and disbursement of non-labor income, having widespread ripple effects across every county.
Take federal payments, for example. In 2012, age, health, and social assistance-related funding comprised 55 percent of the federal budget (e.g., Social Security, Medicare, Medicaid and unemployment). By 2023, these payments are projected to account for 61 percent of the total federal budget.
Future federal policy, whether it changes or stays the same, will affect some local economies more than others. For example, Social Security and Medicare dependent counties tend to be economically stressed, with relatively low average wages, median household income, and educational attainment, yet these counties can benefit from expenditures by retirees, the flow of federal medical payments into the community, and the relatively higher wages in the health care sector.
Given its size and widespread importance, it is surprising that non-labor income receives relatively little attention in terms of assisting economic development or a community’s well-being. As this source of income grows and shifts in the future, those communities, counties, and states that understand and respond to changes in non-labor income will be better situated to perform well and benefit in tomorrow’s economy.
Citation
The manuscript (PDF) has a complete discussion of methods, and it should be cited as Lawson, M.M., R. Rasker, and P.H. Gude. 2014. The importance of non-labor income: an analysis of socioeconomic performance in western counties by type of non-labor income. Journal of Regional Analysis and Policy 44(2): 175-190.
