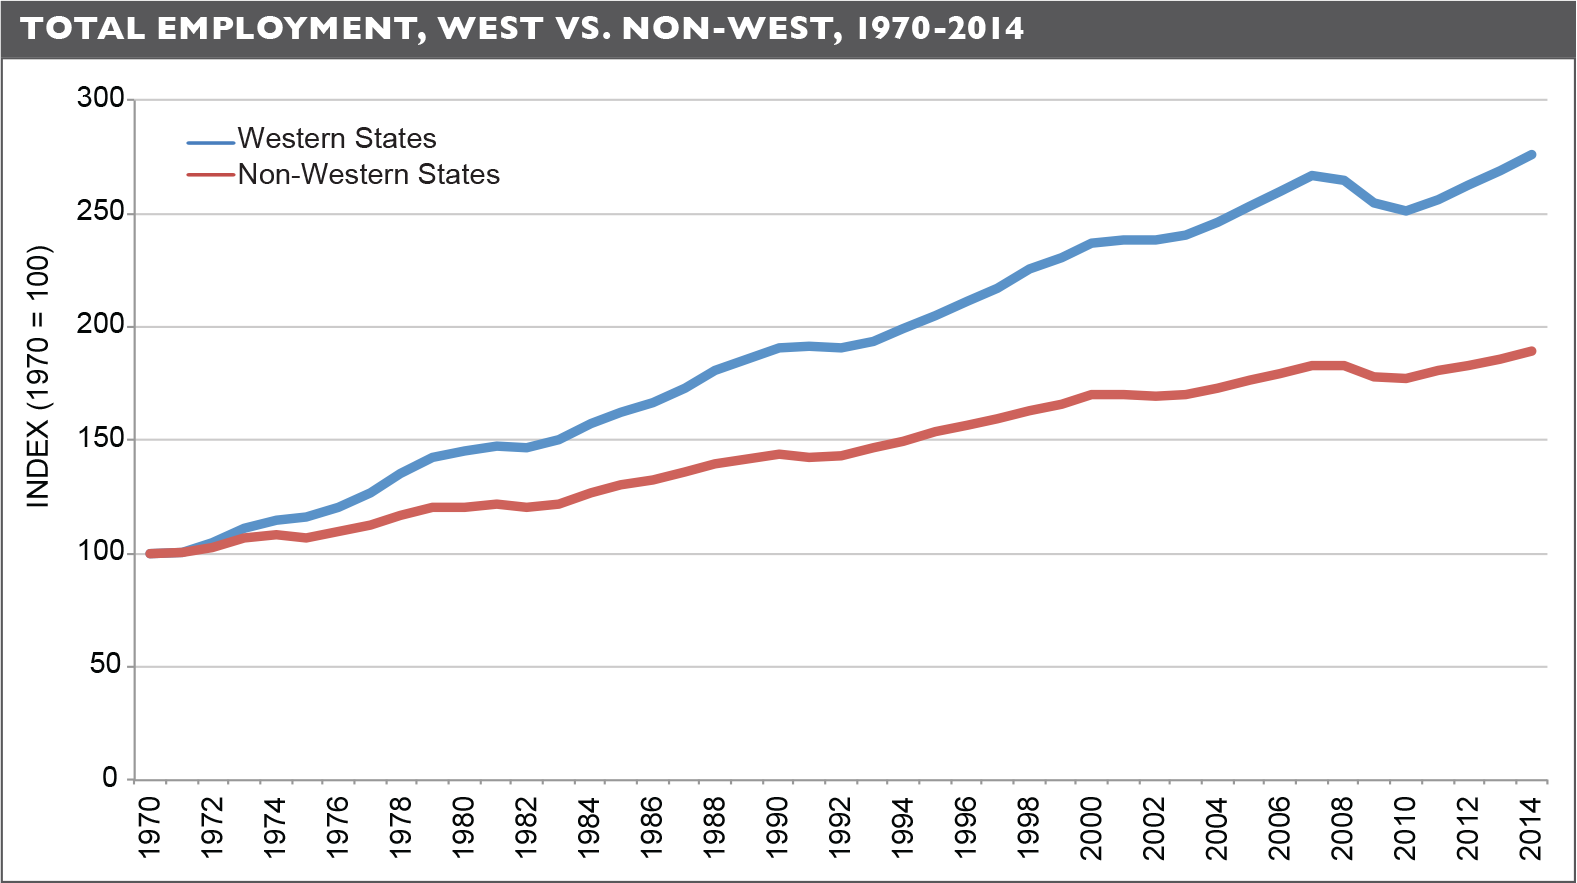
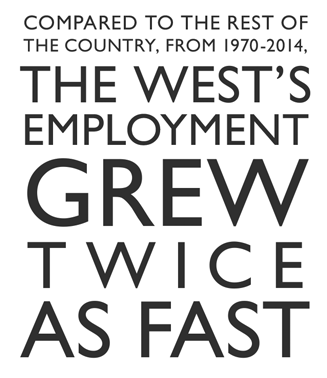
- From 1970 to 2014, the West’s population and employment grew roughly twice as fast as the rest of the country. Real personal income in the West also rose significantly faster than in non-western states.
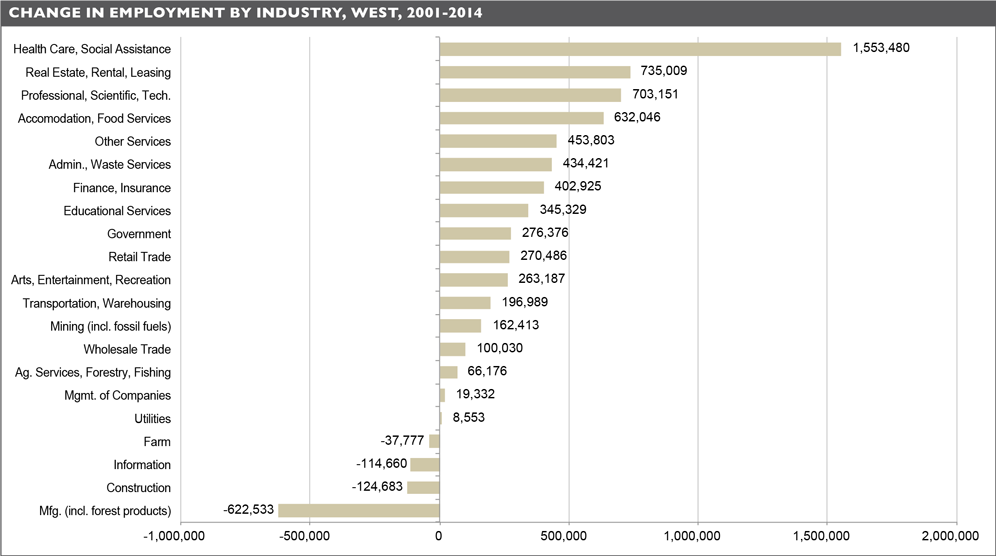
- During the same time, the West’s economy created 5.7 million net new jobs, with 92 percent of the overall growth from services industries such as health care, real estate, and professional, scientific, & technical services.
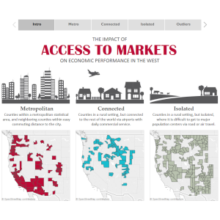
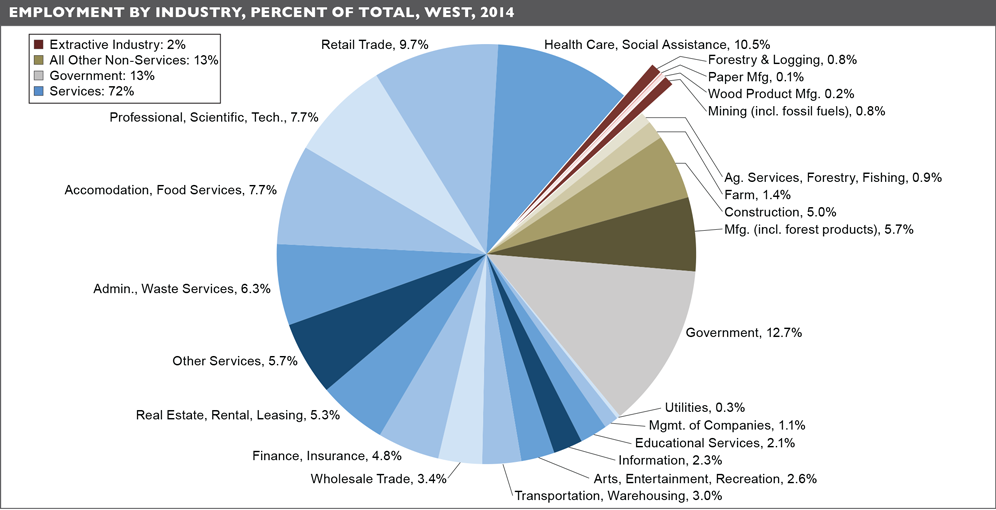
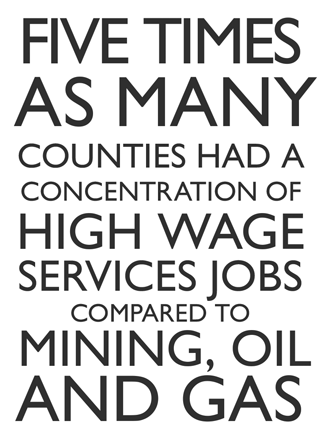
- Today, many more western counties have a high concentration of health care and high wage services jobs compared to forestry, wood products and paper; or mining, oil, and natural gas.
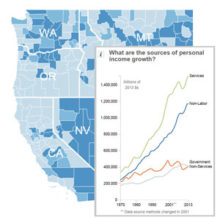
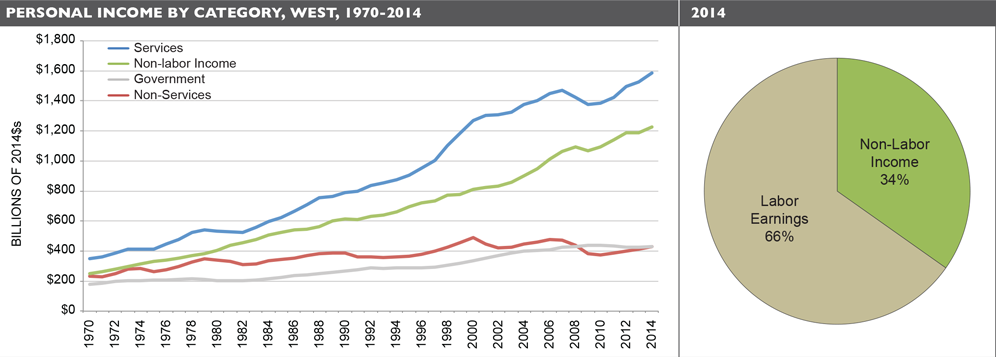
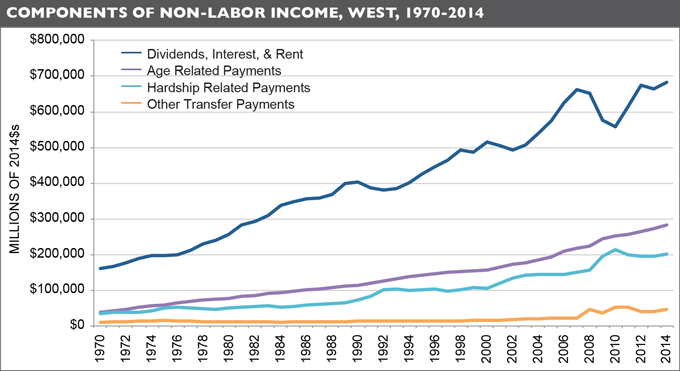
- From 1970 to 2014, non-labor income increased by nearly four-fold in real terms. In 2014, non-labor income—mostly from investments and age-related payments—represented 34 percent of total personal income in the West.
Read the report below, download it as a PDF, or explore the interactive West-Wide Atlas that shows data for every county and state in the continental West.
Employment in the West is outpacing the rest of the country.
Subscribe to our newsletter!
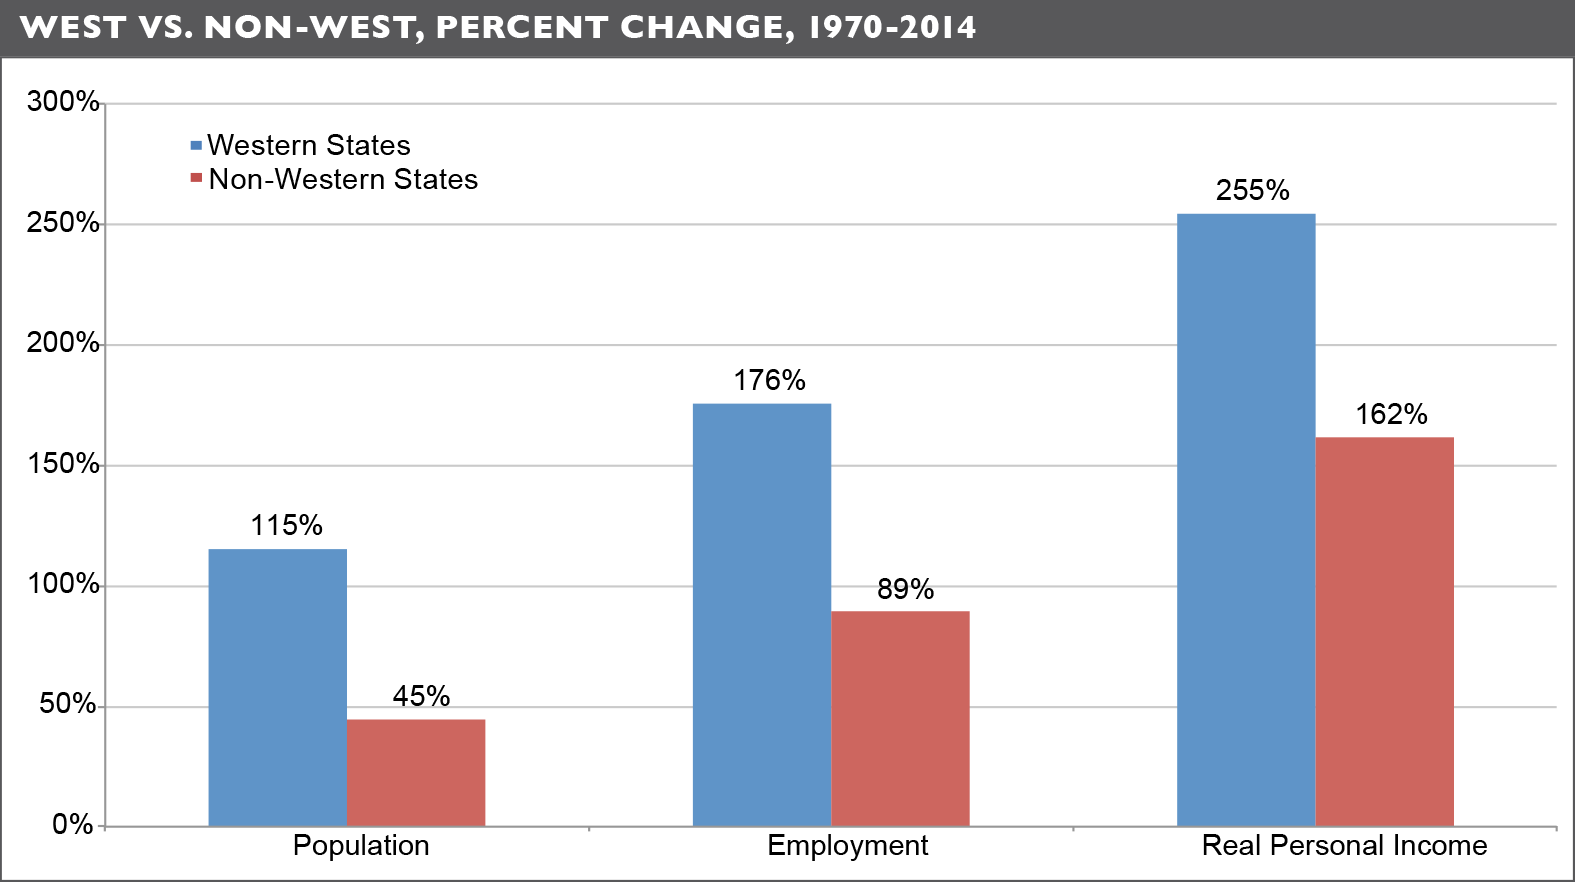
“The western economy has outperformed the rest of the U.S. economy in key measures of growth—population, employment, and real personal income—during the last four decades.”
—West is Best
Services industries, many high-wage, led the West’s job growth, diversifying the region’s economy.
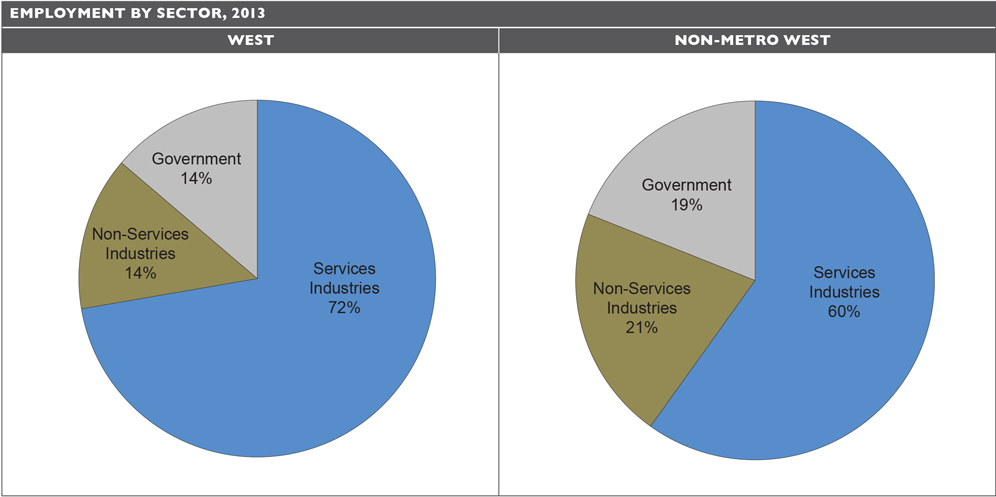
Services are the largest employment sector in both the West overall and in the non-metro West.
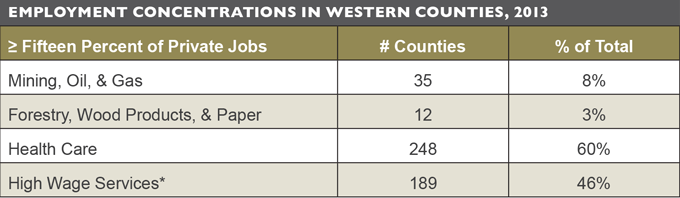
Many more western counties have a high concentration of health care and high wage service jobs compared to forestry, wood products, and paper; or mining, oil, and gas.
Non-Labor income is a large and growing source of personal income.
References
Data in this publication come from U.S. Department of Commerce. 2015. Bureau of Economic Analysis, Regional Economic Accounts, Washington, D.C.; U.S. Department of Commerce. 2013. Census Bureau, County Business Patterns, Washington, D.C. Note: Some data are withheld by the federal government to avoid the disclosure of potentially confidential information. Headwaters Economics uses data from the U.S. Department of Commerce to estimate these data gaps.
The West is defined as the 11 public lands continental western states: Arizona, California, Colorado, Idaho, Montana, Nevada, New Mexico, Oregon, Utah, Washington, and Wyoming. Non-Metropolitan counties are counties without an urbanized area of 50,000 or more population, or a high degree of social and economic integration with a Metropolitan Statistical Area as measured by commuting ties.
Services encompass an array of sectors ranging from low-wage industries such as accommodation and food services to high-wage industries such as professional and technical services, including architects, engineers, and computer programmers. Six services sectors pay on average better than overall earnings per job for all private industries in the West: information; finance and insurance; management of companies and enterprises; professional, scientific, and technical services; wholesale trade; and utilities. For more details on services industries, see North American Industry Classification System (NAICS) definitions, available here: http://www.census.gov/cgi-bin/sssd/naics/naicsrch?chart=2007.
Non-labor income consists of dividends, interest, rent (money earned from investments); age related payments including Social Security, railroad retirement disability benefits, and Medicare; hardship related payments including public assistance medical care (incl. Medicaid), income maintenance benefits (incl. SSI, Food Stamps, etc.), and unemployment; and other payments including workers comp, disability, military and veterans benefits, other transfer receipts, transfers to nonprofit organizations, and education transfer payments. For details on dividends, interest, rent, see: https://bea.gov/about/pdf/acm/2015/may/the-importance-of-non-labor-income.pdf.