- This report, interactive charts, and graphics show, county-by-county, the three types of non-labor income, including investment income, Social Security, Medicare and Medicaid, and welfare—referred to by some economists as the “mailbox economy.” We conclude with implications for the rural West.
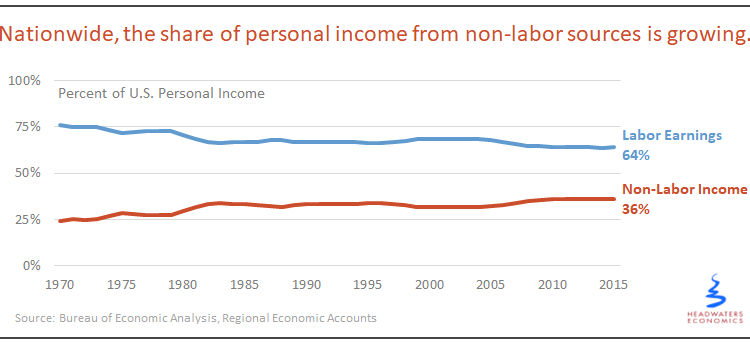
- Non-labor income sources are growing more than twice as fast as labor income and are one-third or more of all personal income in nearly 90 percent of U.S. counties.
- Policies that affect non-labor income—such as reforms to health care, retirement, Social Security, income maintenance programs, and medical benefits—will have widespread effects.
- Rural counties rely disproportionately on non-labor income: 21 percent of rural counties derive 50 percent or more of all personal income from non-labor sources, compared with only three percent of metro counties.
In the U.S. economy, personal income is made up of labor and non-labor sources. Although often overlooked, non-labor income is significant and often the single largest sources and fastest growing component of a county’s economy.1
From 2000 to 2015 (latest county-level data), non-labor income sources in the U.S. grew by 49 percent while labor income grew by 22 percent. By 2015, more than one-third of all personal income in the U.S. economy was from non-labor sources, representing more than half of real personal income growth from 2000 to 2015.2
Non-labor income—depending on the type—can stimulate other sectors of the economy, such as health care, construction, and retail. For example, retirees moving to a community with investment income promote retail sales and home-building, and communities with high dependence on Medicaid may experience growth in local health services.
Non-Labor Income Is Not Equally Distributed
As defined by the Bureau of Economic Analysis of the U.S. Department of Commerce, non-labor income (NLI) consists of two subcategories: Dividends, Interest, and Rent (DIR)3 and Transfer Receipts (TR).
To better understand the size and complexity of non-labor income we reclassified NLI data into the following categories:
• DIR (investment and rental income)
• Age-related payments (Social Security, Medicare), and
• Hardship-related payments (Medicaid, income maintenance benefits, employment compensation insurance).4
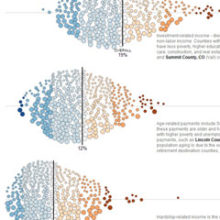
The distribution of Dividends, Interest, and Rent (money earned from investments) is shown in the interactive to the left. In most counties, DIR is the largest source of non-labor income and contributes more than 15 percent of total personal income. DIR can be exceptionally high in resort communities, such as Jackson (Teton County, WY; 76% of personal income from DIR), Sun Valley (Blaine County, ID; 55%), and the San Juan Islands (Island County, WA; 53%).
Dependence on age-related payments (Social Security and Medicare) are shown to the left. Note the heavy reliance on these payments in Appalachia and northern Michigan, for example. By scrolling to individual counties, note how some are heavily reliant on Social Security (such as 17% in Dickenson County, VA) or Medicare (14% in Sumter County, FL).
The reliance of counties on hardship-related payments (Medicaid, income maintenance, unemployment insurance) is shown to the left. Some areas, such as Appalachia, the southeast, southwest, and counties with high Native American populations, may be disproportionately dependent on these forms of payments. Scrolling to individual counties reveals a few illustrative examples: in both Breathitt County, KY and Apache County, AZ more than 20 percent of all personal income is from Medicaid.
Two examples illustrate why it is important to differentiate between types of non-labor income. In Teton County, WY, home of the resort town of Jackson, 79 percent of personal income is from Dividends, Interest, and Rent, an indication that this town’s economy is driven largely by the stock market. In contrast, in Lincoln County, MT, home of Libby, 58 percent of personal income (and 90 percent of net growth in the last 15 years) is from non-labor sources. But, in this county, NLI consists primarily of age-related payments, such as Medicare and Social Security, and hardship-related payments, such as Medicare and welfare programs.
While Jackson’s economy is dominated by a growing tourism and recreation sector spurred by wealthy “amenity migrants” and second-home buyers, Libby’s is characterized by an aging population and higher levels of economic hardship related to the loss of mining and timber jobs and the out-migration of the younger, working population.5 While in Jackson non-labor income stimulates the health care, retail and construction sectors, in Libby it likely only affects the health care sector.
Demographic Changes and Policy Shifts Will Impact Non-Labor Income
Understanding the predominance of non-labor income in a county’s economy—and distinguishing between the various types—is important for three reasons.
(1) Policy changes. Policies that affect the disbursement of non-labor income, such as reforms to health care, retirement, income maintenance, and medical benefits, will have widespread effects, negatively affecting some counties more than others. Lewis County, ID, where age-related payments are 26 percent of all personal income, will be affected more by changes in Social Security and Medicare, while Owsley County, KY, where hardship-related payments make up 38 percent of personal income, will be affected by changes to programs such as Medicaid.
(2) Disproportionate impact on rural counties. This post defines rural as non-metro. In general, rural counties are less prepared to adapt to changing policies that affect non-labor income. The type of non-labor income present can reveal a county’s likelihood to adapt to changing economic conditions. Counties with large Dividends, Interest and Rent payments tend to have less poverty and have an educated, retirement-age population, while counties with large age-related payments (e.g., Social Security, Medicare) are characterized as having relatively lower income, higher poverty, and less education. Counties with large hardship-related payments (e.g., Medicaid and welfare programs) are typically poor, with high unemployment.
(3) Non-labor income continues to grow. Demographic trends, such as the retirement of Baby Boomers, increase the likelihood that in many if not most counties in the U.S. non-labor sources will grow and continue to be the single largest source of personal income.6
Rural Counties Are More Reliant on Non-Labor Income
The significant differences between metro and rural counties highlight the difficulties facing rural counties. Overall, rural counties are surprisingly dependent on non-labor income.
• Twenty-one percent of rural counties derive 50 percent or more of all personal income from all non-labor sources compared to only three percent in metro counties. Rural counties are significantly more dependent on age and hardship-related payments:
• Age-related payments constitute 20 percent or more of all personal income in 16 percent of rural counties compared to four percent in metro counties.
• Hardship-related payments constitute 10 percent or more of all personal income in 26 percent of rural counties compared to seven percent in metro counties.
Personal income from Dividends, Interest and Rent is not very different between metro and rural counties. DIR constitutes 20 percent or more of all personal income in 23 percent of rural counties compared to 17 percent in metro counties. In some rural counties DIR is driven largely by Rent, rather than dividends and interest earnings. “Rent” includes leasing farm land and royalty payments from oil and gas leases. The counties where this is most likely to happen are explained in the accompanying Methods paper.
What Non-Labor Income Dependence Means for the Rural West
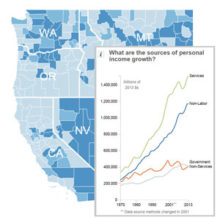
Similar to the U.S. as a whole, in the 11 western states, non-labor income constitutes 30 percent or more of all personal income for 94 percent of all counties. Non-labor income in the West provided 51 percent of net real personal income growth from 2000 to 2015.7
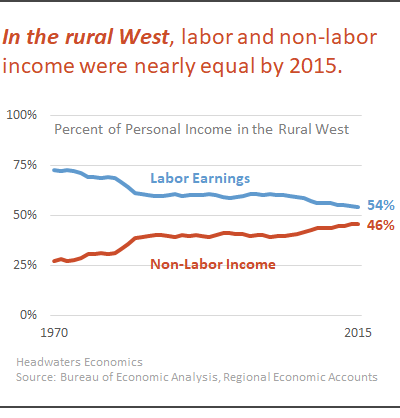
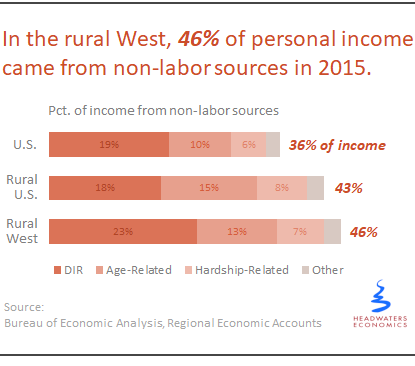
In the rural West, NLI is even more important, providing 46 percent of all personal income and 60 percent of net growth.8 In 1970, 73 percent of personal income in rural western counties was from labor and 27 percent was from non-labor sources. By 2015 the two sources of personal income were almost equal.
The largest component of non-labor income in the rural West is from Dividends, Interest, and Rent. These earnings from past investments constituted 23 percent of total personal income in 2015. Age-related payments (Social Security, Medicare) represent 12.5 percent of total, while hardship-related (Medicaid and welfare) represent another 7.3 percent. From 2000 to 2015 , Dividends, Interest, and Rent grew by 43 percent; age-related payments by 85 percent, and hardship-related payments grew by 106 percent.9
While non-labor income is at least half of all personal income for 91 rural counties (33% of all rural western counties), there are significant differences between counties. For example, in Catron County, NM, non-labor income is 63 percent of total personal income, with 26 percent of total from Dividends, Interest, and Rent and another 26 percent from age-related payments. In contrast, in Navaho County, AZ, the single largest type of non-labor income is from Medicaid, making up 15 percent of all personal income.
Changes to programs such as Medicare will disproportionately affect rural western counties. For example, 83 percent of western counties have 10 percent of all personal income in the form of hardship-related payments; 65 of those counties (78%) are rural. More specifically, 32 western counties have 10 percent of all personal income from Medicare and 29 (90%) are rural counties.
Conclusion: Rural West Economy Surprisingly Dependent on Non-Labor Income
The so-called “mailbox economy” of non-labor income, while often hidden and not well understood, nonetheless is critically important. In many counties in the U.S.—and especially in rural areas—non-labor income is the single largest and fastest-growing part of a county’s economy.
Non-labor income will likely grow as a critical part of the economy. More and more Baby Boomers are reaching retirement age, which is reflected in investment and age-related payments. The ups and downs of the stock market are revealed in Dividends and Interest payments. And increasing poverty is reflected in the growth of hardship-related payments like welfare and Medicaid.
As policy-makers debate reforms to federal entitlement programs and health care, they should consider how the impacts of these policy shifts—of potential changes to programs such as Social Security, Medicare, and Medicaid payments—will be felt differently across the country. Rural counties will be the most negatively affected. Some parts of the country, such as counties in Appalachia, the Southeast, and states like New Mexico and Arizona, will be impacted more than others.
Endnotes
- 1. For detailed definitions of “non-labor income” and data sources, peer-reviewed journal article (Journal of Regional Analysis and Policy), and other information see our 2014 research post. ↑
- 2. Data from: U.S. Department of Commerce. 2016. Bureau of Economic Analysis, Regional Economic Accounts, Washington, D.C. Tables CA05, CA05N & CA35. Detailed state and county-level reports on non-labor income can be produced with our free Economic Profile System tool. ↑
- 3. See the accompanying Methods paper for an explanation of the term Rent and a discussion of where DIR may consist largely of Rent rather than from investment income.↑
- 4. The Bureau of Economic Analysis also reports several “other” sources of transfer payments, consisting of payments from veteran’s benefits, education and training, Workers’ Compensation insurance, railroad retirement and disability, other government retirement and disability, and other receipts of individuals and non-profits. We omit these payments from the interactive tool because they represent only two percent of total personal income in the U.S. ↑
- 5 Lawson, M., R. Rasker, and P. Gude. 2014. “The Importance of Non-Labor Income: An Analysis of Socioeconomic Performance in Western Counties by Type of Non-Labor Income.” Journal of Regional Analysis and Policy. 44(2): 175-190. ↑
- 6. The more than 75 million Baby Boomers (those born between 1946 and 1964) will represent 25% of all workers by 2020. ↑
- 7. The West is defined here as the 11 western contiguous states: Arizona, California, Colorado, Idaho, Montana, Nevada, New Mexico, Oregon, Utah, Washington, and Wyoming. In this post, we define rural as non-metro. Metro counties contain a core population of 50,000 or more people or are “outlying” counties tied economically to the core areas by labor force commuting. These figures were derived by running non-metro reports using our Economic Profile System tool for the 11 western states, and for the non-metro portions of these states. ↑
- 8. U.S. Department of Commerce. 2016. Bureau of Economic Analysis, Regional Economic Accounts, Washington, D.C. Tables CA05, CA05N & CA35. ↑
- 9. The remainder, “other,” represents 2.8 percent of total personal income and grew by 67.5 percent during the same time period. ↑