Home Building, Higher Temperatures Driving Price Tag
Overview
This three-page digest summarizes recent research on how growing residential development near the twelve national forests in the Sierra Nevada area of California has led to increases in fire suppression costs. The research focused on 27 wildland fires during 2006-2009. The full manuscript, “Evidence for the effect of homes on wildfire suppression costs” (1.7M PDF), is peer reviewed and published in the International Journal of Wildland Fire. (Also see these report slides.)
Highlights
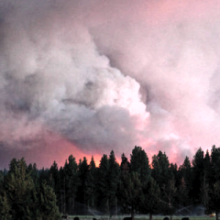
- Rising average summer temperatures are strongly associated with an increase in acres burned. An increase in average summer temperature of 1º F is associated with a 35 percent increase in area burned by wildfires.
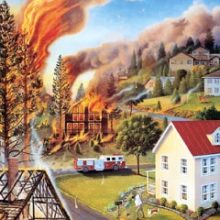
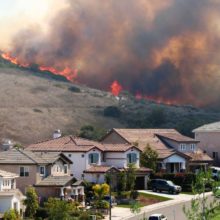
- During the past ten years, twice as many homes were within a mile of a wildfire compared to the 1980s or 1990s. Homebuilding has increased rapidly in the Sierra Nevada area. Since 1950, more than 900,000 homes were built in the study area, and 1,500 square miles of undeveloped private land were converted to low density development. During the past ten years, approximately 13,000 homes were threatened annually by wildfires in the Sierra Nevada; more than twice the number of homes threatened by wildfires compared to the 1980s or 1990s due to the increase in area burned by wildfires and sprawl.
- For fires in the Sierra Nevada, one-third of suppression costs are related to protecting homes. For the average U.S. Forest Service wildfire, 35 percent of total firefighting costs in the study area are associated with protecting homes. The cumulative cost of the 27 wildfires in the study was $496 million, of which we estimate $173 million were suppression costs related to homes.
- Additional firefighting costs associated with new homes depend on how many homes already are present. On average, the total estimated cost to protect a home within six miles of a fire was $81,650, but ranged significantly from $1,513 to $683,928. In low-density areas, the cost of adding a single home can be incredibly high. If only one home is within six miles of a fire, the additional cost of a new home is $57,151 daily–or $2 million for the duration of a 35-day fire. By comparison, a new home added to a development of 50 existing homes costs $1,143 daily or $40,000 for the duration of a 35-day fire.
Policy Implications
- Keeping new housing within denser residential areas would reduce future firefighting costs by millions of dollars. Leaving land undeveloped saves the most taxpayer dollars.
- Today federal and state taxpayers pay a large portion of the cost of wildfires. If costs instead were borne in part by those who build at-risk homes, or by local governments who permit them, it would help pay for rising costs and may discourage new home development in high risk areas.
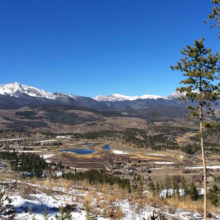
Study Area: Wildfires in the Sierra Nevada

| Fire | Year | Cumulative Cost | Firefighting Days | Avg Size of Fire (sq.km.) | Avg Homes within 6 mi | Estimated % of Cost Related to Housing | Estimated Cost Related to Housing | Avg Cost per Home within 6 mi of the Fire | |
|---|---|---|---|---|---|---|---|---|---|
| American River Complex | 2008 | $22,795,346 | 62 | 41 | 543 | 38% | $8,632,299 | $15,909 | |
| Antelope Complex | 2007 | $8,433,644 | 10 | 86 | 229 | 34% | $2,876,942 | $12,591 | |
| Backbone | 2009 | $16,897,750 | 20 | 22 | 2 | 8% | $1,367,856 | $683,928 | |
| Bassetts | 2006 | $7,687,375 | 12 | 7 | 537 | 38% | $2,945,062 | $5,489 | |
| Big Meadow | 2009 | $16,947,242 | 25 | 22 | 76 | 28% | $4,809,234 | $63,279 | |
| Canyon Complex | 2008 | $45,166,766 | 58 | 91 | 1,808 | 43% | $19,645,399 | $10,865 | |
| China-Back Complex | 2007 | $2,934,617 | 12 | 9 | 265 | 35% | $1,023,542 | $3,865 | |
| Clover | 2008 | $8,199,100 | 46 | 24 | 68 | 22% | $1,821,328 | $26,983 | |
| CUB Complex | 2008 | $21,117,153 | 31 | 37 | 103 | 27% | $5,787,144 | $55,930 | |
| Elephant | 2009 | $2,094,034 | 7 | 1 | 12 | 18% | $369,021 | $32,089 | |
| Fletcher | 2007 | $4,092,990 | 12 | 24 | 5 | 13% | $526,425 | $105,285 | |
| Happy Camp | 2006 | $10,264,472 | 64 | 10 | 84 | 24% | $2,485,728 | $29,749 | |
| Harrington | 2009 | $478,642 | 27 | 1 | 0 | 0% | $0 | ||
| Hat Creek Complex | 2009 | $7,874,824 | 9 | 37 | 693 | 40% | $3,111,378 | $4,490 | |
| Hidden | 2008 | $9,182,999 | 26 | 9 | 15 | 19% | $1,775,767 | $115,310 | |
| Iron Complex | 2008 | $72,226,070 | 79 | 89 | 1,088 | 42% | $30,018,633 | $27,601 | |
| Kingsley Complex | 2006 | $7,998,835 | 18 | 4 | 1 | 3% | $276,577 | $414,865 | |
| Knight | 2009 | $12,122,449 | 21 | 15 | 3,689 | 46% | $5,580,928 | $1,513 | |
| Lime Complex | 2008 | $62,050,552 | 99 | 311 | 2,494 | 45% | $27,810,936 | $11,149 | |
| Moonlight | 2007 | $33,088,547 | 31 | 208 | 1,007 | 41% | $13,429,680 | $13,341 | |
| Piute | 2008 | $24,229,665 | 28 | 108 | 1,532 | 42% | $10,165,654 | $6,637 | |
| Ralston | 2006 | $13,849,333 | 15 | 21 | 938 | 41% | $5,656,858 | $6,032 | |
| Red Rock | 2009 | $4,188,332 | 15 | 4 | 18 | 20% | $848,028 | $47,113 | |
| Siskiyou Complex | 2008 | $44,860,758 | 100 | 204 | 34 | 24% | $10,733,398 | $313,731 | |
| Ukonom Complex | 2008 | $25,623,333 | 99 | 126 | 121 | 31% | $7,853,225 | $64,698 | |
| Wallow | 2007 | $4,973,823 | 29 | 6 | 67 | 28% | $1,377,270 | $20,556 | |
| Whiskey | 2008 | $6,857,372 | 29 | 29 | 63 | 27% | $1,873,669 | $29,899 | |
| Total: | $496,236,023 | 15,489 | $172,801,979 | ||||||
| Percent of total costs related to housing: 35% | Ave.cost/home: $81,650 | ||||||||
| Of the 27 fires we studied in Sierra Nevada and Northern California that burned between 2006 and 2009, on average 35% ofthe total firefighting costs were related to the defense of homes. This added up to almost $173 million spent to protect homes {out of of a total firefighting bill of more than $496 million). The average cost to protect a home within 6 miles of the fire was $81,650, but ranged significantly, in some fires costing more than $300,000 per home. | |||||||||